Análisis de mercado español
El análisis del mercado energético español es clave para comprender la dinámica y las tendencias que afectan al sector tanto a nivel local como internacional. En este análisis de mercado, abordamos los factores importantes que influyen en los precios de la energía, la oferta y la demanda, y las últimas políticas regulatorias. Esta completa panorámica te permitirá estar al día de los cambios semanales y anticiparte a las posibles variaciones del mercado energético, tanto en España como en otros mercados relevantes como Francia.
Indice
Junio 2025
Cifras clave del mes
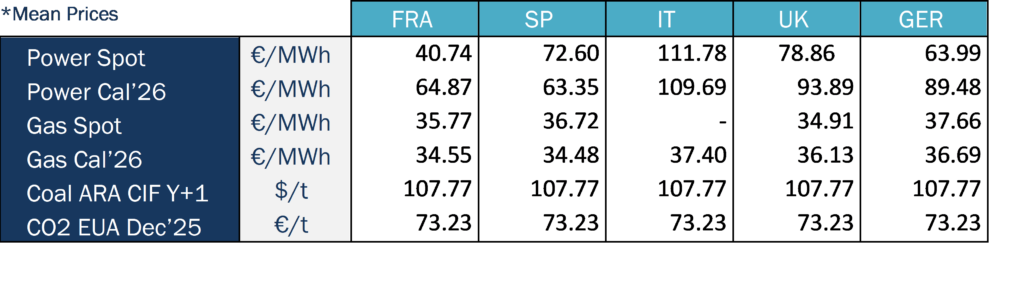
En junio de 2025, los precios de la electricidad en los mercados europeos comenzaron a repuntar, tras el periodo de bajos precios registrado durante la primavera. Este aumento se debe principalmente a:
- Aumento de los precios del gas y del CO₂.
- Crecimiento de la demanda debido al aumento de las temperaturas
- Variación de la generación renovable.
El récord de generación solar y eólica en varios países ayudó a contener los picos de precios y provocó precios horarios negativos durante las horas centrales del día.
Francia (40,74 €/MWh) fue el único país con un precio medio inferior a 50 €/MWh. En contraste, España experimentó un fuerte repunte, al pasar de 16,97 €/MWh en mayo a 72,60 €/MWh en junio, lo que representa un incremento aproximado del 328 %. Por su parte, Alemania fue el único país cuyo precio medio disminuyó respecto al mes anterior, 63,99 €/MWh frente a 67,34 €/MWh, aunque en ambos casos los precios se mantuvieron en niveles similares.
Durante la primera semana del mes, los precios subieron en la mayoría de los mercados como resultado del aumento de la demanda y al alcanzar los futuros del CO₂ y del crudo Brent máximos de varios meses. No obstante, la producción solar siguió empujando algunos precios horarios por debajo de cero.
En la segunda semana, la mayoría de los mercados registraron precios medios semanales superiores a 50 €/MWh, en un contexto de continuación al alza de los precios del gas y del CO₂. Los precios negativos persistieron durante las horas diurnas, impulsados por la fuerte generación solar.
En la tercera semana, los precios superaron los 70 €/MWh en numerosos mercados. En el Reino Unido, la península ibérica e Italia se alcanzaron jornadas con precios diarios por encima de los 100 €/MWh. La combinación de altas temperaturas y el incremento de los precios del gas elevó significativamente la demanda y los costes de generación. Sin embargo, la generación solar alcanzó máximos históricos en Alemania y Francia, mientras que Portugal registró su mayor producción solar para un día de junio. En paralelo, los futuros del Brent alcanzaron su nivel más alto desde enero.
En la última semana de junio, los precios de la electricidad descendieron en la mayoría de los mercados debido al descenso en el precio del gas y el CO₂ y a una mayor generación eólica. A pesar de ello, España, Portugal e Italia continuaron registrando jornadas con precios diarios superiores a 100 €/MWh. Estos mercados también registraron récords diarios de generación solar, lo que contribuyó a suavizar los niveles generales de precios.
El mercado del gas mostró una tendencia claramente alcista durante las tres primeras semanas del mes, en gran medida debido a las tensiones geopolíticas en Oriente Medio entre Irán, Israel y EE. UU. Sin embargo, una cierta estabilización del conflicto contribuyó a moderar los precios en la última semana. En conjunto, la media mensual superó los niveles registrados en mayo De forma paralela, los precios del gas para Cal’26 también aumentaron. Cabe destacar además el anuncio del 30 de junio sobre los primeros cargamentos de GNL procedentes de Canadá. Esto supone un aumento de la oferta y podría contribuir a incrementar las opciones de suministro de gas y a mantener los precios del gas más estables.
Por su parte, el precio del EUA CO₂ EUA para Dec’25 se incrementó notablemente, pasando de 71.15 €/t en mayo a 73.23 €/t en junio. El precio del carbón CIF ARA Y+1 también experimentó un ligero aumento, alcanzando los 107.77 €/t. En conjunto, junio se caracterizó por una elevada volatilidad e incertidumbre en los mercados energéticos, con subidas generalizadas en los precios de las principales materias primas.
Demanda energética y mix de generación
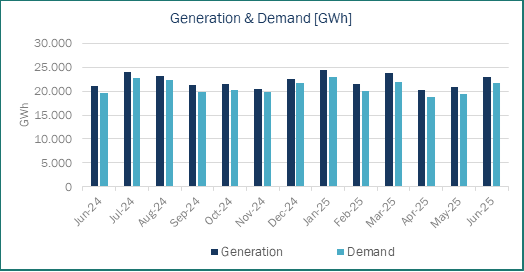
En junio se ha incrementado la demanda de electricidad en España hasta los 21.686 GWh, mientras que el valor de la generación total fue de 23.008 GWh. Ambos valores se situaron por encima de los registrados en junio de 2024 y mayo de 2025. Este aumento se ha debido principalmente a las altas temperaturas registradas en junio, pues ha sido el mes de junio más caluroso jamás registrado en España, provocando una mayor demanda de electricidad.
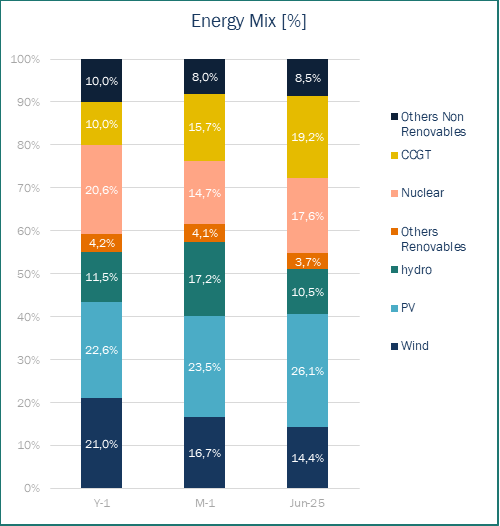
En Junio’25, las energías renovables mantuvieron su posición como primera fuente de generación eléctrica en España, con un 54,2% del mix de generación, aunque por debajo del 61,5% del mes anterior. La energía fotovoltaica se erigió como la primera fuente de generación, con un 26,1%. No obstante, se ha observado un pronunciado descenso en otras tecnologías renovables. La contribución de la energía eólica cayó al 14,4%, por debajo tanto de May’25 (16,7%) como de Jun’24 (21,0%), mientras que la generación hidroeléctrica descendió al 10,5%.
La menor producción renovable fue parcialmente compensada por el aumento de la producción nuclear, que alcanzó el 17,6%. Esta cifra es superior a la de May’25 (14,7%), pero inferior a la de Jun’24 (20,6%). La disponibilidad del parque nuclear se vio condicionada por varios eventos operativos, como dos paradas imprevistas en la central nuclear de Almaraz, una debida a la entrada de agua el 2 de junio y otra por la activación del relé de protección del generador el 18 de junio. Ascó I también sufrió una parada imprevista el 5 de junio para investigar una entrada de agua, mientras que Ascó II estuvo fuera de servicio por recarga de combustible hasta el 19 de junio.
El mayor crecimiento interanual lo protagonizaron los ciclos combinados, que ascendieron a la segunda posición en el ranking de generación con el 19,2% de la producción total. Esta participación casi duplica la registrada en Jun’24 (10,0%) y representa un incremento notable respecto a May’25 (14,7%). El aumento en la generación con CCGT responde principalmente a la caída de la producción eólica y a su papel esencial en el mantenimiento de la estabilidad de la red gracias a su inercia de rotación, a pesar de sus mayores costes operativos.
Source: Haya Energy Solutions
Precios de las energía y panorama del mercado
Source: Haya Energy Solutions
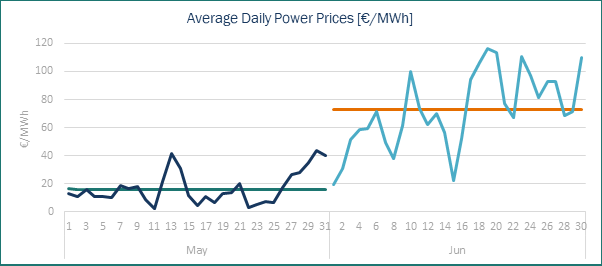
El precio medio de la electricidad en España para Jun’25 ascendió a 72,59 €/MWh, lo que representa un importante aumento del 430% respecto a May’25, que fue de 16,86 €/MWh. Esto representa un aumento mensual significativo, impulsado por tres factores clave. En mayo de 2025 se registró la media mensual más baja del año; un notable descenso de la generación de energía renovable (sobre todo de origen eólico e hidráulico); y un aumento de los precios del gas. Comparado con Jun’24, cuando el precio medio era de 56,08 €/MWh, el de este año ha aumentado casi un 30%.
A pesar del aumento del precio medio de la electricidad, el impacto de la generación solar fotovoltaica sigue siendo evidente, ya que continúa siendo la tecnología líder en cuanto a su contribución al mix energético. Durante 14 de los 30 días de junio se registraron precios cero o negativos en al menos una hora del día, concentrándose principalmente en las horas del mediodía, coincidiendo con los máximos de irradiación.
El precio horario más bajo registrado en junio fue de -6 €/MWh, ocurrido el 1 de junio entre las 13:00 y las 16:00 horas. Por otro lado, el precio horario más alto alcanzó los 210 €/MWh a las 21:00 horas del 16 de junio. Esta gran disparidad entre los valores mínimo y máximo refleja la elevada volatilidad del mercado eléctrico durante el mes.
Source: Haya Energy Solutions
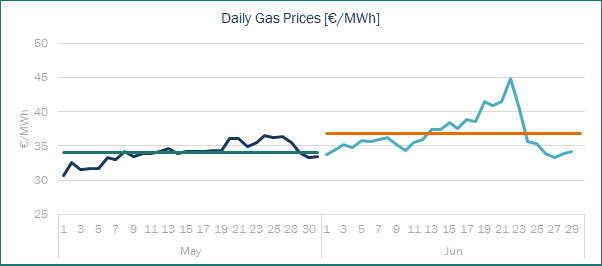
En junio de 2025, el precio medio del gas en el mercado MIBGAS alcanzó los 36,77 €/MWh, registrando un incremento respecto a los 34,05 €/MWh de May’25. Esta subida siguió una tendencia al alza iniciada el mes anterior. El aumento se ha debido en gran medida a la escalada del conflicto entre Israel e Irán, en la que también ha participado Estados Unidos. La preocupación ante una posible escalada que pudiera llevar a Irán a cerrar el Estrecho de Ormuz -por el que circula aproximadamente el 20% del crudo mundial- creó una gran incertidumbre en los mercados, lo que hizo que los precios alcanzaran su punto máximo durante la tercera semana del mes. Sin embargo, ante la declaración de un alto el fuego en la última semana del mes, los precios empezaron a bajar al anticiparse los mercados a la evolución del conflicto.
Tendencias y futuros de mercado
Source: Haya Energy Solutions
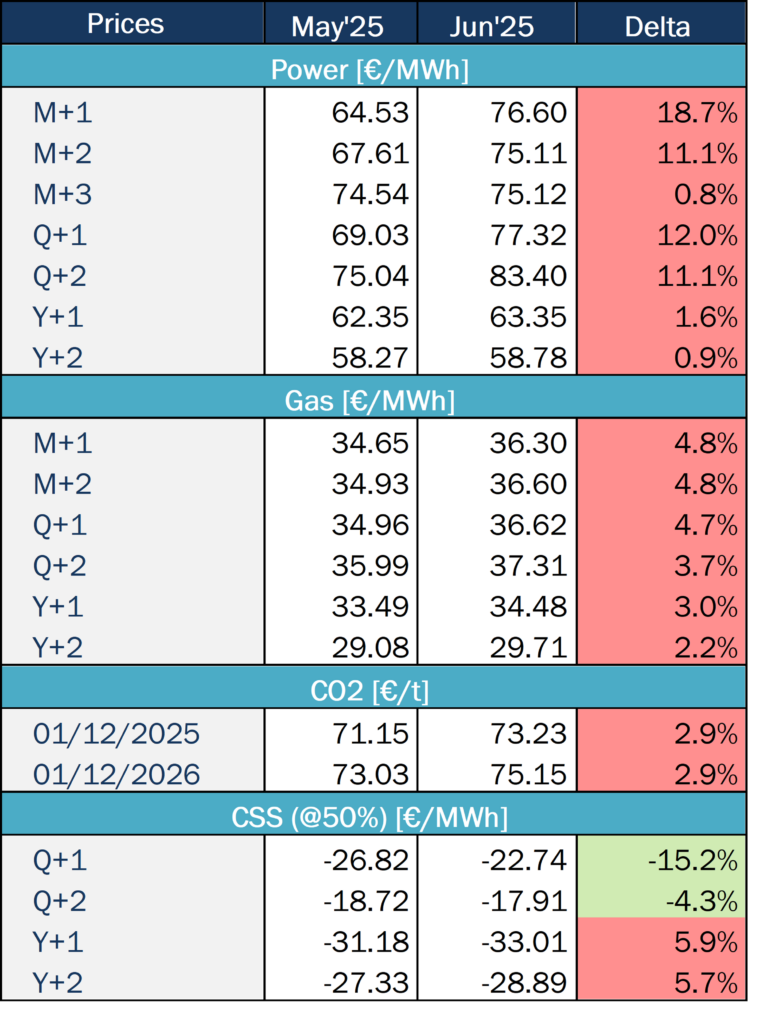
Entre May’25 y Jun’25 se ha registrado un notable incremento en los precios de todos los productos del mercado energético.
En cuanto a los precios de la energía, los productos a corto plazo (mensuales y trimestrales) son los que han experimentado mayores subidas. Por ejemplo, el producto M+1 ha registrado un aumento de casi el 20%. Por el contrario, los productos anuales san mostrado una mayor estabilidad, experimentando subidas menos significativas. Esto sugiere que este repunte puede ser de carácter temporal, apuntando a una mayor estabilidad en los precios a largo plazo.
Como se ha mencionado, los precios del gas han registrado aumentos en todos los horizontes temporales. Tanto los contratos mensuales como los trimestrales y anuales experimentaron subidas similares, situadas entre el 2% y el 5%.
Los precios del CO2 también han seguido esta tendencia al alza, con un aumento de casi el 3% en los precios EUA tanto para 2025 como para 2026.
Como consecuencia del repunte en los precios de la electricidad, el CSS ha sido el único indicador que ha mostrado una mejora respecto al mes anterior. No obstante, esta mejora se limita a los productos trimestrales, siendo especialmente notable en el Q+1. Por el contrario, los productos anuales presentan perspectivas menos favorables que en el mes previo.
En junio, los futuros del Brent han experimentado una importante volatilidad. Sin embargo, en la última semana, los precios se han estabilizado debido al alto el fuego en el conflicto de Oriente Medio, a un posible aumento de la producción por parte de la OPEP+ en agosto y a la continua incertidumbre en torno a la demanda mundial.
El conflicto comenzó el 13 de junio con un ataque israelí y estadounidense a las instalaciones nucleares iraníes, que provocó una escalada de los precios del Brent. Sin embargo, el alto el fuego acordado 12 días después contribuyó a aliviar la presión alcista sobre los precios. Además, la OPEP+ ha anunciado un aumento de la producción de 411.000 bpd para agosto, tras incrementos similares en mayo, junio y julio.
Estos acontecimientos han contribuido a aportar cierta estabilidad al mercado tras el repunte inicial provocado por las tensiones geopolíticas. Desde entonces, el mercado ha mostrado un comportamiento más estable. De cara a las próximas semanas, se anticipa un aumento de la demanda impulsado por las altas temperaturas y el mayor consumo eléctrico asociado a la refrigeración.
SP Baseload Power price (€/MWh)
SP Peak load Power price (€/MWh)
EUA price (€/t)
MIBGas price (€/MWh)
Coal Price ($/Tn)
Gas efficiency: 52%
Coal efficiency: 38%
Gas vs. Coal Price (€/MWh)
Gas efficiency: 52%
Coal efficiency: 38%


