Key Insights from the French Market Analysis
Analysis of the French energy market is key to understanding the dynamics and trends affecting the sector both locally and internationally. In this detailed analysis, we address the important factors influencing energy prices, supply and demand, and the latest regulatory policies. This comprehensive overview will allow you to keep up to date with weekly changes and anticipate possible market variations, both in France and in other relevant markets such as Spain.
Table of Contents
June 2025
Key figures of the month
Energy demand and generation mix
In June 2025, electricity consumption in France during peaks in demand averaged 49.6 GW. The peak in electricity demand in June was reached on Monday 30 June, with 57.9 GW, well above the levels seen the previous month (43.4 GW). This is due to the heatwave that has been affecting France since the last week of the month. Same for gas production, warmer weather has boosted demand and therefore gas generation, this trend has not been noticed last year.
In terms of the generation mix, average nuclear generation in the sixth month of the year was 39.8 GWh. The average maximum output was reached mid-June (41.8 GWh), and the average minimum output was reached on Sunday 30th. The last week of the month, 12 reactors in the French nuclear fleet were on scheduled shutdown.
In terms of renewable energy sources, as you can see from the graph, the days were sunnier than in previous months and PV production comes second in the total energy mix, representing a 19.6% out of the total production and first in the renewable energy category which was not the case, last June 2024, hydro production was second after nuclear. Hydro energy comes third in the total energy mix, representing 14.5%. Hydroelectric stocks increased from 2077 GWh (at the end of May) to 2630 GWh (at the end of June), below last year’s level (2945 GWh). However, the stocks have rose significantly since the beginning of May and were close to last year’s level until beginning of June.

Source: Haya Energy Solutions
Energy prices & market panorama
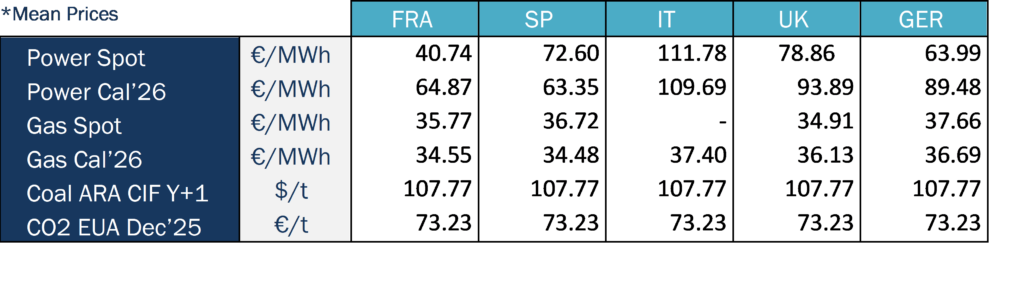
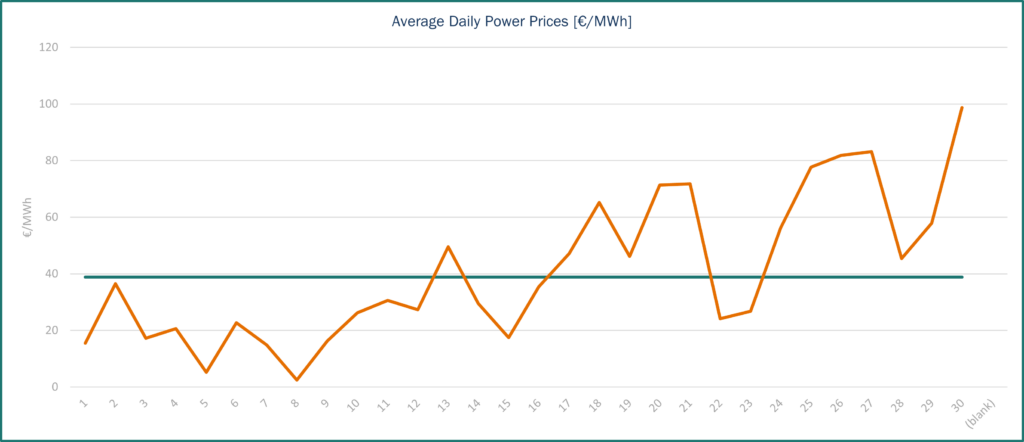
Average electricity prices for day-ahead base contracts in France reached €41.96/MWh, higher to May’s levels (€19.36/MWh). As the graph shows, prices fluctuated considerably throughout the month with the minimum price for the day-ahead base contract being €2.49/MWh on 9thJune, and the maximum price €83.22/MWh on 26rdJune. At the beginning of June 2025, electricity prices in France were shaped by different factors. Nuclear power generation helped keep prices low during shoulder hours, supported by mild temperatures. However, in mid to late June, several bullish factors emerged, pushing electricity prices higher. The discovery of stress corrosion at the Civaux-2 nuclear reactor sent shockwaves through the power market, echoing the situation from two years ago when widespread reactor shutdowns due to similar issues led to significant supply constraints. As a result, the French Cal-26 contract surged by 6.3% in a single day, with most of the increase concentrated in the winter quarters, periods typically marked by tighter supply and greater reliance on nuclear output. In addition, a major heatwave developed, pushing temperatures in France up to 6°C above seasonal norms. This droved a spike in cooling demand and also reduced run-of-river hydro production due to the associated dry weather pattern.
Source: Haya Energy Solutions
Regarding imports and exports, in June, France was in a position of net exporter with all its borders, including Spain which was not the case in the previous months. The maximum level of exports for the month was 15,832 MW.
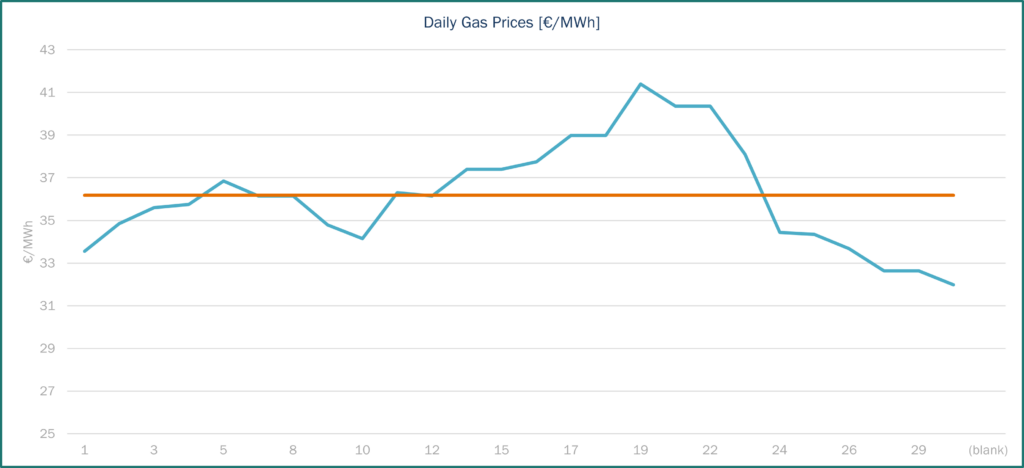
Gas prices, the TTF spot contract closed at €31.97/MWh on 30rd June. Since the beginning of the year, the trend has been downwards, except mid-February when TTF gas reached its peak price (€58.98/MWh 10/02/2025), after which prices fell in fits and starts. Then, the trend resumed its upward trajectory in early May, peaking on 19 June (€41.40/MWh), the highest level since early April. Finally, TTF spot prices fell sharply (down 10 points) to return to early May levels (before the increase). The European gas balance remains tight, and EU gas stocks are 58.9% full on average, compared to 77.42% last year. France’s gas storage levels are at 66.29%, below 2024 (68.04%).
Source: Haya Energy Solutions
Market trends and futures
Source: Haya Energy Solutions
June was marked by heightened geopolitical tensions, particularly in the Middle East, as the escalation between Israel, the United States, and Iran dominated headlines. On June 13th, Israel launched a large-scale attack on Iran’s nuclear and military infrastructure. This triggered an immediate reaction in the oil and gas markets, with Brent crude rising in two days, moving from $72.70/b to $74.60/b. Gas prices in Europe also spiked, with TTF climbing reflecting increased geopolitical risk and market concerns over potential disruptions.
Tensions escalated further on June 21st and 22nd, when the United States carried out coordinated strikes targeting Iran’s nuclear facilities. Brent spiked to over $80/b. The gas market showed a more muted reaction, with a modest increase, as the conflict had no direct impact on physical gas flows.
A ceasefire was announced on June 23rd and came into effect on June 24th, easing tensions significantly. As a result, oil prices began to retreat, with Brent correcting back to $68/b, close to pre-conflict levels. Similarly, TTF shed its geopolitical premium, falling back towards 34€/MWh, ending the month almost flat compared to early June, as the market reassessed the actual supply risks.
Regulation
On June 17th, the European Commission proposed a gradual ban on Russian gas and oil imports by the end of 2027, aiming to fully eliminate the EU’s dependency on Russian fossil fuels. The proposal includes a ban on new Russian gas contracts starting January 2026, with existing short-term contracts ending by June 2026 and long-term ones phased out completely by December 2027. Additionally, from 2028, Russian-controlled LNG terminal service contracts will be prohibited. This regulatory shift seeks to improve the EU’s energy security and resilience, although it raises concerns about the need for sufficient diversification plans among Member States.
At the same time, the EU is facing internal debate over its recently adopted methane emissions law, which imposes strict monitoring and reporting requirements for gas imports. Some Member States and U.S. LNG exporters argue that the rules could jeopardize transatlantic gas trade, particularly given the fragmented nature of U.S. upstream infrastructure. Discussions are underway about introducing flexibility mechanisms or equivalency agreements to avoid disrupting supply while maintaining climate goals.
Last month, we mentioned that the EU Parliament has approved greater flexibility regarding gas storage obligations; the revised rules allow Member States to meet the target anytime between October 1 and December 1, based on their withdrawal schedules. This month, an informal agreement on June 24th was proposed to extend the EU’s 2022 gas storage regulation until December 31, 2027, beyond its original end date of 2025. Moreover, once the 90% target is met, it should not be required to maintain that level until 1 December. Member States may deviate from the target by up to 10 percentage points in challenging market conditions, with the European Commission able to authorize further flexibility for one season if such conditions persist. The informal deal was scheduled for a committee vote end of June.


