Spanish Market Analysis
Analysis of the Spanish energy market is key to understanding the dynamics and trends affecting the sector both locally and internationally. In this detailed analysis, we address the important factors influencing energy prices, supply and demand, and the latest regulatory policies. This comprehensive overview will allow you to keep up to date with weekly changes and anticipate possible market variations, both in Spain and in other relevant markets such as France.
Table of Contents
June 2025
Key figures of the month
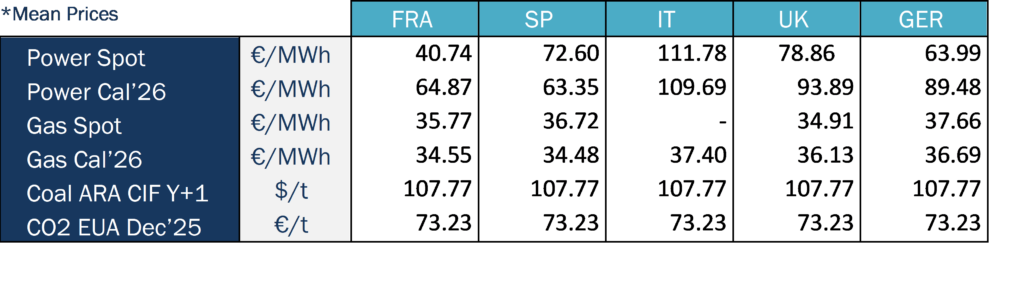
In June 2025, electricity prices in European markets began to climb again, following the low prices experienced during spring. The increase was mainly driven by:
- Higher gas and CO₂ prices.
- Growing demand due to rising temperatures, varying renewable generation.
The record in solar and wind output in several countries helped limit price spikes and led to negative hourly prices during midday hours.
France (40.74 €/MWh) was the only country with an average spot price below 50 €/MWh. Spain experienced a sharp increase, rising from 16.97 €/MWh in May to 72.60 €/MWh in June—an approximately 328% rise. In contrast, Germany was the only country with a lower average price in June compared to May, at 63.99 €/MWh versus 67.34 €/MWh, although prices in both months remained at similar levels.
In the first week of the month, prices rose in most markets as demand increased and CO₂ and Brent crude futures reached multi-month highs. Despite this, solar production continued to push some hourly prices below zero.
In the second week, most markets recorded average weekly prices above 50 €/MWh, with gas and CO₂ prices continuing to climb. Negative prices persisted during daylight hours, driven by strong solar generation.
By the third week, prices exceeded 70 €/MWh in many markets. In the UK, Iberia, and Italy, daily prices surpassed 100 €/MWh on some days. The combination of rising temperatures and higher gas prices boosted demand and costs. However, solar generation reached new records in Germany and France, while Portugal saw its highest solar output for any June day. Brent oil futures also reached their highest level since January.
In the last week of June, prices fell in most markets thanks to lower gas and CO₂ prices and stronger wind generation. Even so, Spain, Portugal, and Italy still experienced daily prices over 100 €/MWh on some days. These markets also set new daily solar generation records, helping to ease overall price levels.
The gas market showed a clear upward trend during the first three weeks of June, largely driven by tensions in the Middle East involving Iran, Israel, and the U.S. However, a certain stabilization in the conflict moderated gas prices in the last week of the month. Overall, the monthly average exceeded the levels recorded in May. Similarly, Cal’26 gas prices also experienced an increase. Furthermore, news from the first LNG cargoes coming from Canada on the 30th of June. This increases the offer and may help to increase gas supply options and keep gas prices more stable.
CO₂ prices (EUA for December 2025) rose notably, climbing from 71.15 €/t in May to 73.23 €/t in June. The CIF ARA Y+1 coal price also saw a slight increase, reaching €107.77/t. Overall, June was a volatile and uncertain month for energy markets, with rising prices across all key energy commodities.
Energy demand and generation mix
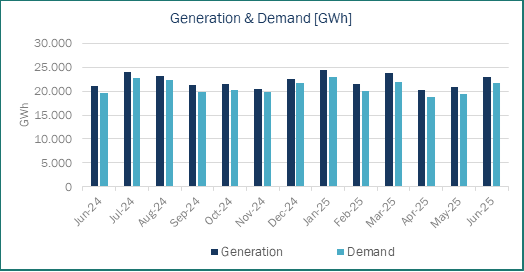
In June 2025, a higher electricity demand in Spain was reached 21,686 GWh, while total generation was 23,008 GWh. Both figures were higher than those of June 2024 and May 2025. The increase was primarily driven by record-high temperatures in June, the hottest month on record in Spain, leading to higher electricity demand.
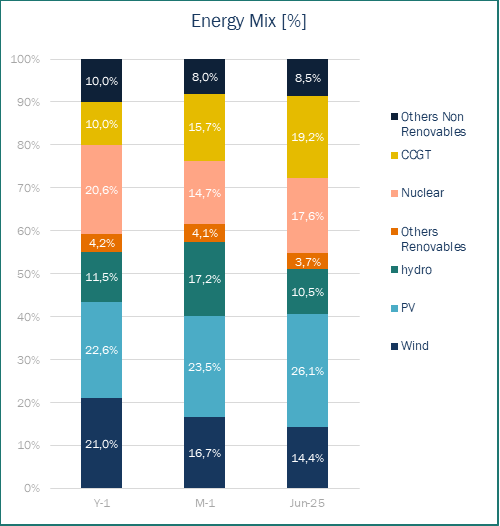
In June 2025, renewable energy sources remained the leading contributor to Spain’s electricity generation, accounting for 54.2% of the total mix, though down from 61.5% in the previous month. Solar PV emerged as the first generation source, accounting for 26.1% of the mix. However, a pronounced decrease was observed in other renewable technologies. Wind power contribution fell to 14.4%, below both May’25 (16.7%) and Jun’24 (21.0%), while hydroelectric generation declined to 10.5%.
Renewable generation decreased, partially offset by increased nuclear output, which reached 17.6%. This is higher than May 2025 (14.7%) but lower than June 2024 (20.6%). The performance was impacted by operational issues, including two unplanned outages at the Almaraz nuclear plant—one due to water ingress on June 2 and another from a generator protection relay activation on June 18. Ascó I also faced an unplanned shutdown on June 5 for water ingress investigation, while Ascó II was offline for refuelling until June 19.
The most significant growth was registered in CCGT, which climbed to second position in the generation ranking with 19.2% of total output. This represents nearly double the contribution compared to Jun’24 (10.0%) and a substantial increase over May’25 (14.7%). The CCGT increased was driven by both the decline in wind generation and their essential role in maintaining grid stability through rotational inertia provision, notwithstanding higher operational costs.
Source: Haya Energy Solutions
Energy prices & market panorama
Source: Haya Energy Solutions
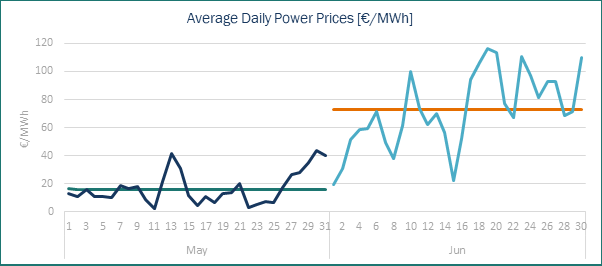
The average electricity price in Spain for Jun’25 climbed to 72.59 €/MWh, representing a significant increase of 430% compared to May’25, which was 16.86 €/MWh. This represents a significant monthly increase, driven by three key factors. May 2025 saw the lowest monthly average of the year; a notable decline in renewable energy generation (particularly from wind and hydro sources); and an increase in natural gas prices. Compared to Jun’24, when the average price was 56.08 €/MWh, this year’s price has increased by almost 30%.
Despite the increase in the average electricity price, the impact of solar photovoltaic generation remains evident as it continues to be the leading technology in terms of its contribution to the energy mix. Of the 30 days in June 14 recorded zero or negative prices for at least one hour during the day. These situations mostly occurred around midday, when solar irradiation is at its strongest.
The lowest hourly price of -6 €/MWh was recorded on 1 June between 1 p.m. and 4 p.m., while the highest hourly price of 210 €/MWh was reached at 9 p.m. on 16 June. This reflects the significant difference between the minimum and maximum prices.
Source: Haya Energy Solutions
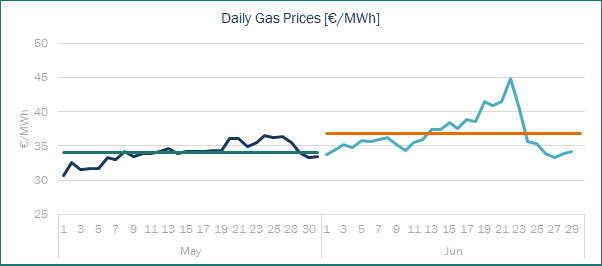
In June 2025, the average gas price in the MIBGAS market reached €36.77 per megawatt-hour (MWh), an increase from €34.05 per MWh in May 2025. This rise followed an upward trend that began the previous month. The increase was largely driven by the escalating conflict between Israel and Iran, which also involved the United States. Concerns about a potential escalation that could lead Iran to close the Strait of Hormuz—through which approximately 20% of the world’s crude oil flows—created significant uncertainty in the markets, causing prices to surge to their peak during the third week of June. However, with a ceasefire declared in the final week of the month, prices began to decline as markets anticipated further developments in the conflict.
Market trends and futures
Source: Haya Energy Solutions
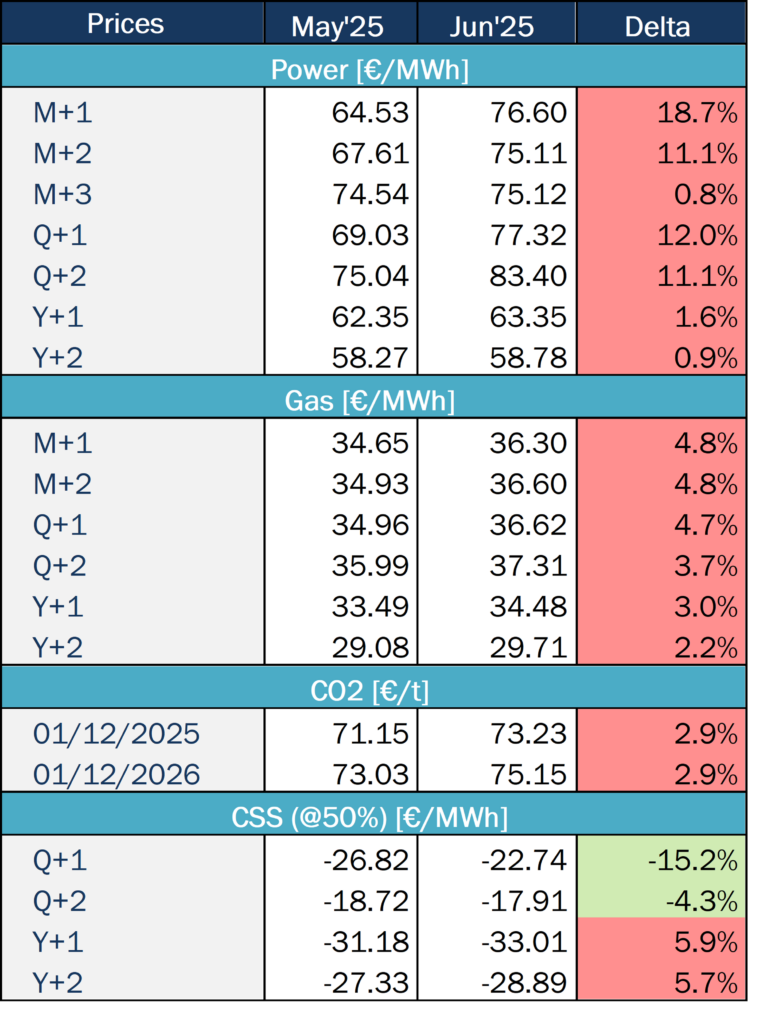
From May’25 to Jun’25, there was a noticeable rise in energy market prices for all products.
As for energy prices, it was the short-term products — monthly and quarterly — that experienced the largest increases. In the case of M+1, for example, the increase was almost 20%. However, annual products remained more stable or experienced less significant rises. This suggests that the increase may be circumstantial and that greater long-term stability is on the horizon.
As previously mentioned, gas prices increased across all timeframes. All products showed the same level of increase: between 2% and 5% for monthly, quarterly and yearly contracts.
CO2 prices also followed this upward trend, with EUA prices for both 2025 and 2026 increasing almost 3%.
Due to rising electricity prices, the CSS is the only parameter that has improved since last month. However, this is only the case for quarterly products, and the effect is more pronounced in Q+1. In contrast, annual products have worse prospects than last month.
In June, Brent crude futures have experienced significant volatility. However, in the last week, prices have stabilized due to a ceasefire in the Middle East conflict, a potential production increase by OPEC+ in August, and ongoing uncertainty around global demand.
The conflict began on June 13 with an Israeli and US attack on Iranian nuclear facilities, which caused Brent prices to spike. However, a ceasefire agreed 12 days later helped ease the upward pressure on prices. In addition, OPEC+ has announced a production increase of 411,000 bpd for August, following similar hikes in May, June, and July.
These developments have helped to bring a degree of stability to the market after the initial surge driven by geopolitical tensions. Market has been stable since then. An increase in demand is expected for the upcoming weeks, due to the hot weather and power demand for cooling purposes.
SP Baseload Power price (€/MWh)
SP Peak load Power price (€/MWh)
EUA price (€/t)
MIBGas price (€/MWh)
Coal Price ($/Tn)
Gas efficiency: 52%
Coal efficiency: 38%
Gas vs. Coal Price (€/MWh)
Gas efficiency: 52%
Coal efficiency: 38%


