Key Insights from the French Market Analysis
Analysis of the French energy market is key to understanding the dynamics and trends affecting the sector both locally and internationally. In this detailed analysis, we address the important factors influencing energy prices, supply and demand, and the latest regulatory policies. This comprehensive overview will allow you to keep up to date with weekly changes and anticipate possible market variations, both in France and in other relevant markets such as Spain.
Table of Contents
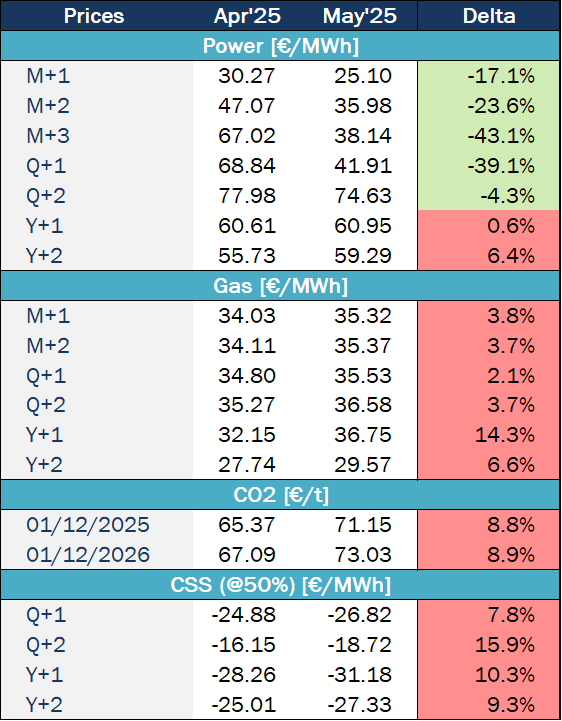
May 2025
Key figures of the month
Energy demand and generation mix
In May 2025, electricity consumption in France during peaks in demand averaged 46 GW. The peak in electricity demand in May was reached on Wednesday 07 May, with 51.1 GW, well below the levels seen the previous month (57.8 GW).
In terms of the generation mix, average nuclear generation in the fifth month of the year was 38.1 GWh. The average maximum output was reached at the beginning of May (41.4 GWh), and the average minimum output was reached on Sunday 25th. The last week of the month, 19 reactors in the French nuclear fleet were on scheduled shutdown.
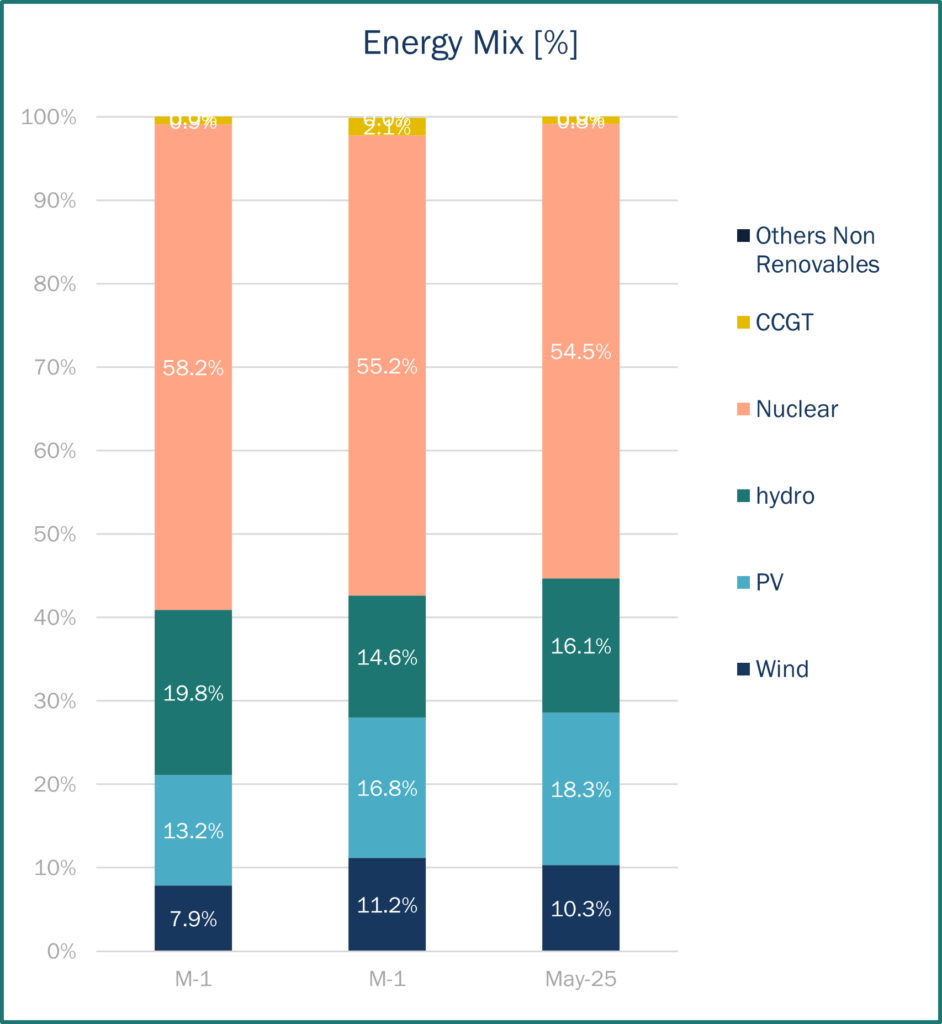
In terms of renewable energy sources, as you can see from the graph, PV production comes second in the total energy mix and first in the renewable energy category. Solar production represents 17.4% and on three days during the month, exceeded 14.5 GWh per day (08, 23 and 30 May). Hydro energy comes third in the total energy mix – second time since October 2024 (April was the 1st time). Hydroelectric stocks increase from 1,212 GWh (at the end of April) to 1,873 GWh (at the end of May), below last year’s level (2,010 GWh).
Source: Haya Energy Solutions
Energy prices & market panorama
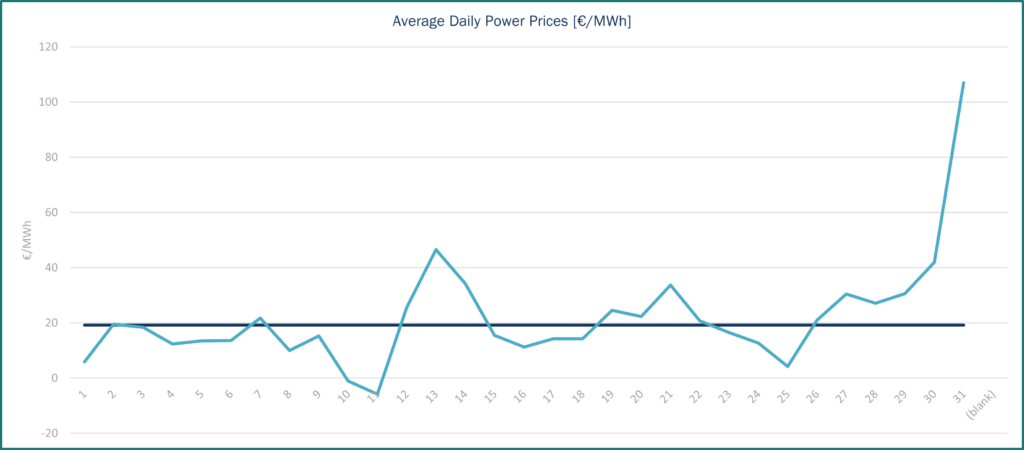
Average electricity prices for day-ahead base contracts in France reached €19.36/MWh, lower to April‘s levels (€37.19/MWh). Spot prices continue to fell under the combined effect of higher temperatures, low demand, high solar production and interconnexions with Spain. As the graph shows, prices fluctuated considerably throughout the month with the minimum price for the day-ahead base contract being €4.2/MWh on 26th May, and the maximum price €42/MWh on 29th May. In May 2025, electricity prices in France were influenced by several factors: a combination of cheap Spanish exports, a temporary surge in wind generation, and flexible nuclear output. In most European countries, exceptionally high solar production at midday is driving prices down to nearly €0/MWh, reflecting a temporary supply surplus. However, with wind and hydroelectric production remaining low, prices are rebounding sharply in the evening, except in France and Spain. In addition, geopolitical tensions, such as the discussion between Trump and Putin to advance peace talks in Ukraine, have brought volatility to the market.
Regarding imports and exports, in May, France was in a position of net exporter with all its borders, except for Spain, as seen last month, for which France imported more than it exported. Oversupply in Spain has an impact on French prices. The maximum level of exports for the month was 16,343 MW.
Source: Haya Energy Solutions
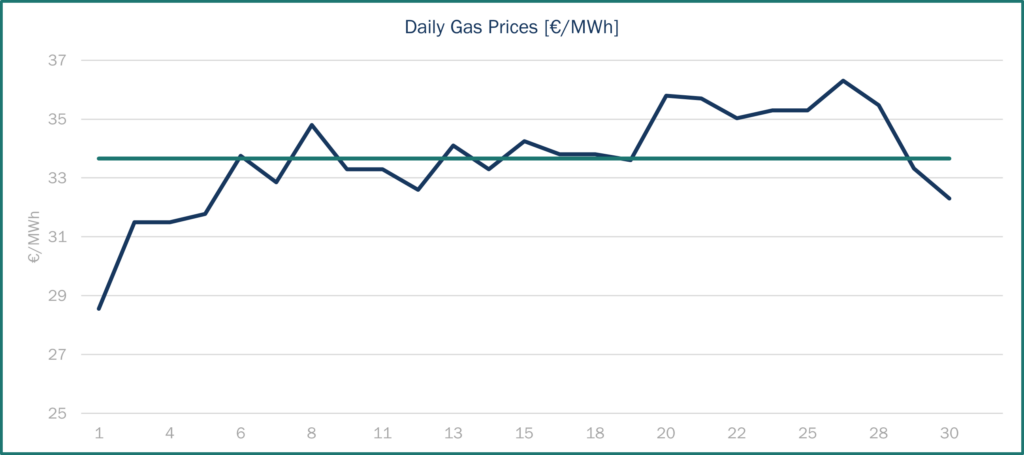
Gas prices, the TTF spot contract closed at €33.56/MWh on 30rd May. From January to February, the trend has been upwards, until mid-February when TTF gas reached its peak price (€58.98/MWh 10/02/2025), after which prices fell in fits and starts. At the beginning of May, the TTF spot contract was €32/MWh and by the end of the month it had exceeded €33/MWh. Between these two periods, prices rose slightly (with the highest price reaching €38/MWh) due to geopolitical tensions and competition for LNG supplies.
Source: Haya Energy Solutions
LNG supply security remains a central issue. The U.S. Energy Secretary confirmed that LNG exports to Europe will continue to grow, citing active contract discussions. However, with Europe’s gas balance tightening, there’s growing concern that falling prices could drive LNG volumes elsewhere. This comes as Asian countries move to lock in more U.S. LNG to ease trade tensions and avoid tariffs. The U.S. is pushing both Asia and Europe to commit to long-term deals, intensifying competition with Qatar, which has recently struggled to secure term contracts in East Asia.
EU gas stocks are 48.3% full on average, compared to 69.98% last year. France’s gas storage levels are at 55.3%, below 2024 (58.99 %).
Market trends and futures
Source: Haya Energy Solutions
At the start of the month, oil prices continued their downward trajectory, driven by a combination of structural and geopolitical pressures. Brent crude fell below $60 per barrel, hitting $59.3, the lowest level since early April. This drop was fueled by a combination of macroeconomic weakness, including a decline in U.S. GDP in the first quarter, ongoing trade tensions between the U.S. and China, and escalating divisions within OPEC+. The situation was further aggravated by a widespread blackout across the Iberian Peninsula, which temporarily shut down refineries and added to the market’s bearish sentiment. Oversupply concerns, coupled with unresolved geopolitical tensions and weak economic indicators, suggest continued downward pressure on oil prices in the months ahead.
An uncoordinated phone call between Trump and Vladimir Putin raised concerns in Europe but sparked cautious optimism in energy markets. Some traders anticipated the potential for a ceasefire or at least a softening of sanctions on Russia. However, the call delivered no tangible results. While Trump spoke of peace negotiations, Putin made no concessions, and the absence of new U.S. sanctions made it clear that little progress was likely.
Toward the end of the month, attention focused on OPEC+. New leaks confirmed that a further acceleration of production increases was under serious discussion. A decision was anticipated at the group’s 1 June meeting, which was unexpectedly moved forward to 31 May. It would mark the third consecutive month of tripling the planned monthly hike, well beyond the pace originally set to phase out 2024 cuts over 18 months. This acceleration signaled a broader intent, especially from leading producers like Saudi Arabia, to regain market share by increasing supply even in a context of fragile demand.
Regulation
Storages: EU parliament adopts revised fill-up targets
On May 8th, the EU Parliament adopted the regulation project loosening the rules setting gas storage fill-up targets, and making them more flexible: instead of the 90% target by 1st November, the new target will be reduced to 83%, to be achieved any time between October 1st and December 1st.
The draft law seeks to address speculation on the gas market and bring down prices, by introducing greater flexibility in rules on gas storage refilling, to ease tensions in the gas market, as speculation surrounding the existing mandatory 90% fill rate target by 1 November each year was driving the cost of refilling during the summer. Member states would also be allowed to deviate by up to four percentage points from the filling target in the event of unfavourable market conditions, such as supply disruptions or high demand. The Commission may further increase this deviation by up to an additional four percentage points if these market conditions persist.
Member states would however have to ensure that the cumulative effects of flexibilities and derogations do not bring down overall storage filling obligations below 75%.


