Financial markets offer a fascinating mirror of collective sentiment. A stock price is not just the outcome of a company’s current performance: it reflects the discounted value of the future profits that investors anticipate. When a stock “outperforms,” expectations have been revised upward. When it falls sharply, the market is signalling that future prospects appear less promising. In a sector as dynamic and politically sensitive as energy, these expectation shifts are especially pronounced.
Over the past ten years, the energy market has experienced several narrative cycles: the spectacular rise of renewables, the collapse and then unexpected rebound of oil and gas, the gradual return of nuclear energy, and the – at times overstated – euphoria surrounding hydrogen. Sector ETFs provide a valuable lens to observe these movements because they aggregate the performance of multiple representative companies within a given technology or sector. Their trajectory reflects the market’s sentiment toward an entire segment rather than any individual player.
This article, which does not constitute investment advice, aims to outline these major historical trends without forecasting future performance. We choose to analyze ETF price returns rather than total returns, as our purpose is not to assess final investment profitability but to understand how the market’s expectations about each sector have evolved.
Solar: the decade’s highly cyclical yet top performer
If the evolution of the solar sector could be summarized in one image, it would be a curve that rises overall but with dramatic swings. The TAN ETF, which tracks major photovoltaic companies, shows roughly +80% price return over the past decade. But this average masks extreme volatility.
Between 2019 and 2021, TAN rose by more than 200%, driven by a very favorable combination of factors: continuous panel cost declines, supportive public policies, strengthened climate ambitions, and abundant capital. The dominant conviction was that solar would become the cornerstone of the global energy transition.
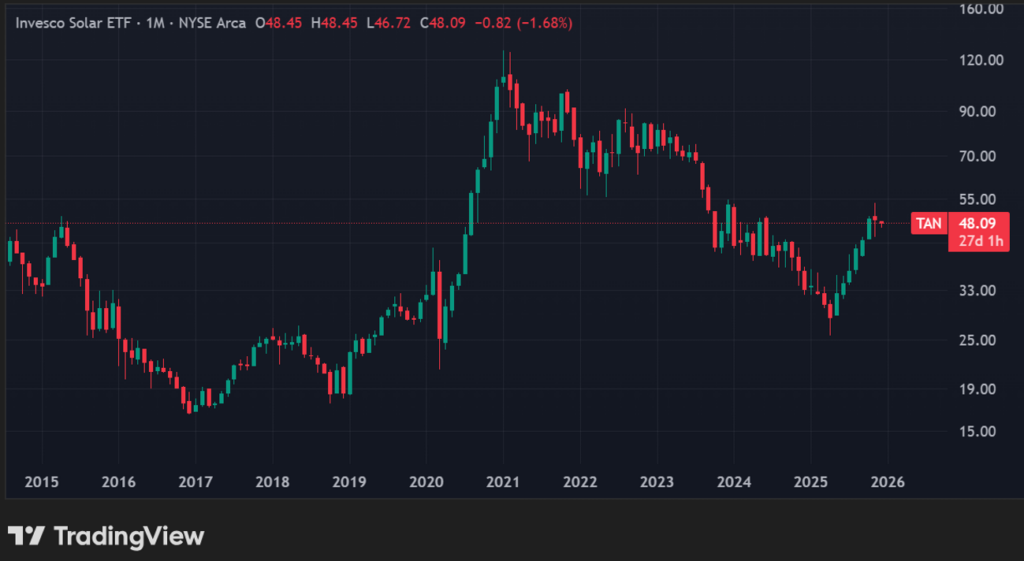
This euphoria was followed by a sharp correction: rising interest rates, material cost inflation, margin pressure from Asian overcapacity, and slower installation rates in some markets. Between 2022 and 2024, TAN lost nearly half its value. The market did not abandon solar’s potential but revised expectations downward to more realistic levels, reflecting the difficulty of sustaining profitable growth in a competitive environment marked by strong cost pressures.
Wind: enormous potential, heavy constraints
Wind energy—approximated through the ICLN ETF, which includes many wind-related and broader clean-energy players—returned about +45% over ten years. Like solar, it enjoyed strong optimism from 2018 to 2021, spurred by booming offshore projects in Europe and ambitious renewable-energy policies.
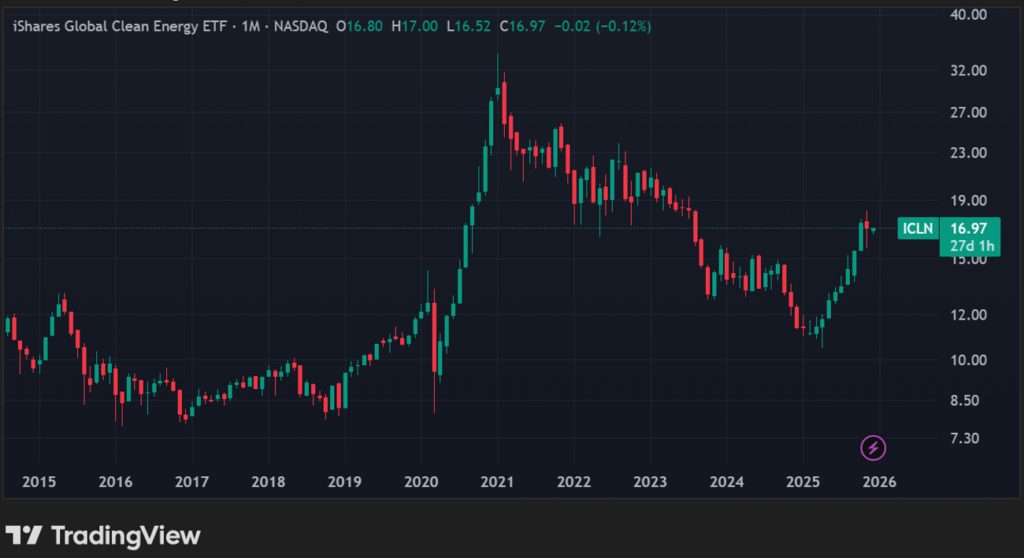
But 2022 and 2023 brought a severe setback. Raw material inflation, higher financing costs, and repeated delays in offshore tenders reshuffled the entire landscape. The market recognized that profitability in parts of the sector was more fragile than expected. Valuations fell sharply—not because wind technology lacked potential, but because the financial and industrial conditions surrounding it had deteriorated.
Oil & Gas: the unexpected resilience of fossil fuels
Perhaps the decade’s most striking lesson is this: hydrocarbons are far from disappearing, and markets realized this abruptly from 2021 onward.
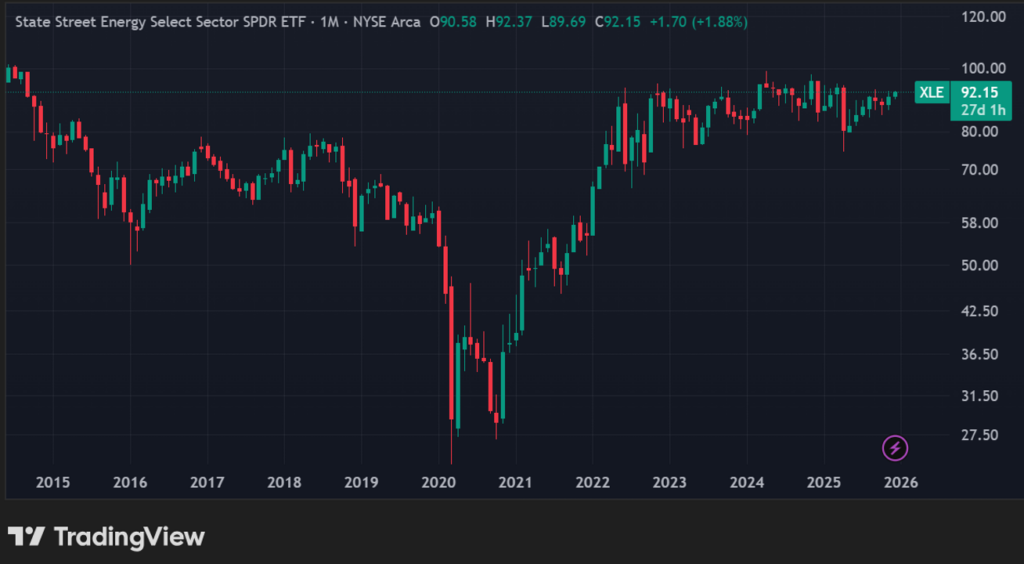
The XLE ETF, representing major U.S. oil and gas companies, posted a +55% performance over the past ten years. Yet the first half of the decade suggested a long-term decline: the 2014–2016 oil price crash, rising ESG pressures, chronically weak margins, and the historic demand collapse in 2020 during the Covid crisis. At that time, XLE was deep in negative territory.
But the post-pandemic economic rebound, the 2022 European energy crisis, and soaring gas prices reshaped everything. Between 2020 and 2023, XLE doubled (and tripled from its lows), driven by geopolitical tensions and years of underinvestment that left supply structurally tight. Investors upgraded their cash-flow expectations, acknowledging that oil and gas would remain essential longer than previously assumed.
Nuclear: discreet but steadily rising
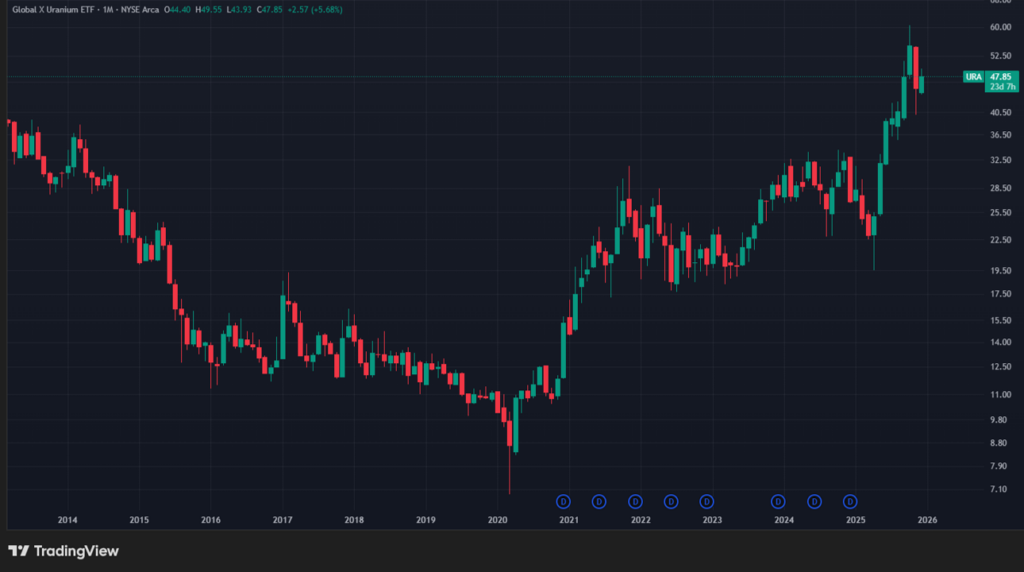
Nuclear energy is a special case: unlike solar or oil, no ETF focuses exclusively on nuclear electricity generation. The most common proxy is the URA ETF, centered on uranium and the mining companies that extract it.
In pure price return terms—excluding dividend reinvestment—URA shows moderate but clear growth over ten years, consistent with a renewed market interest in nuclear. The trend is positive but more muted than suggested by total return metrics, since much of URA’s historical performance comes from mining-sector distributions.
This upward trend reflects three structural dynamics: recognition of nuclear’s role in decarbonization, the emergence of small modular reactors (SMRs), and the rising price of uranium driven by anticipated global demand growth.
Still, the market remains cautious. Large nuclear projects continue to face high costs, recurring delays, and fluctuating political support. Investor interest is real but measured: nuclear is seen as essential, yet slow to deploy.
Hydrogen: from dreams of ubiquity to reassessment
Green hydrogen is likely the technology that has produced the most dramatic market shifts, although the ten-year view is limited because dedicated ETFs are relatively new.
The two main hydrogen ETFs are:
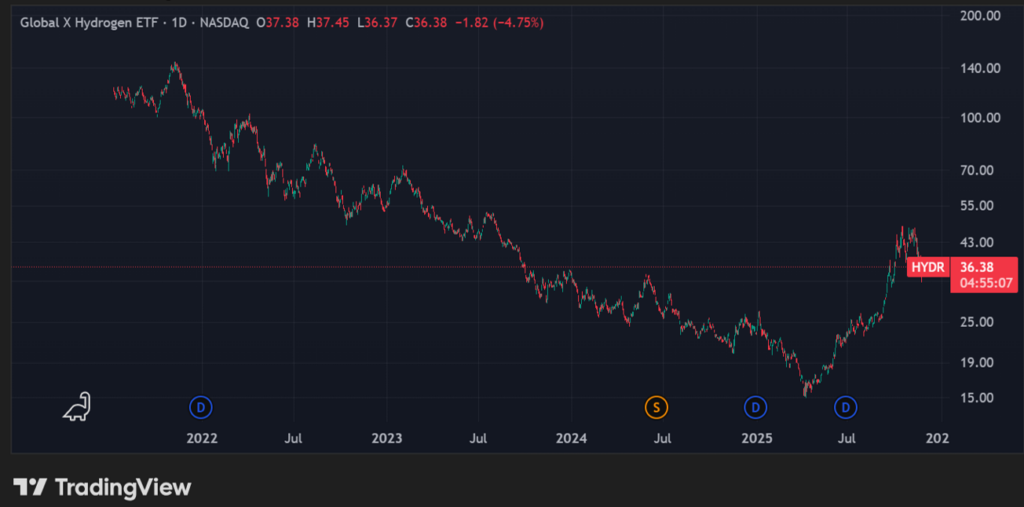
- Global X Hydrogen ETF (HYDR) – launched July 2021
- Defiance Next Gen H2 ETF (HDRO) – launched March 2021
Upon launch, these ETFs benefited from strong momentum: ambitious public policies (EU, Korea, Japan, U.S.), large industrial announcements, and hopes for decarbonizing steel, transport, and fertilizers. From mid-2021 to late 2021, both HYDR and HDRO rose quickly, reflecting market enthusiasm.
But from 2022 onward, their prices dropped sharply, falling below initial levels. This reversal reflects a deep revision of expectations:
- green hydrogen production costs remain high
- heavy dependence on subsidies
- limited number of fully operational projects
- uncertainty around final uses
- rising interest rates penalizing capital-intensive projects
Although the limited historical data prevents long-term conclusions, the market clearly shifted from the exuberance of 2021 to the normalization of 2022–2024. Hydrogen ETFs no longer represent a bet on imminent revolution but rather a cautious interest in targeted industrial applications that will take years to mature.
Summary Table:
![]()
Conclusion: markets don’t predict—they narrate
Three lessons emerge from this decade.
First, markets reward technologies when a powerful narrative takes hold—this was true for solar, wind, and hydrogen. Second, they can quickly reverse expectations when economic conditions shift, as seen in the corrections of 2022–2024. Finally, they can also restore value to sectors believed to be in decline, such as oil and gas, when geopolitical and physical realities demand it.
Sector ETFs help us observe these changing moods: they do not tell us which technology will dominate tomorrow, but they show how investors constantly reassess their hopes and fears.
Thibault Uhl