Key Insights from the French Market Analysis
Analysis of the French energy market is key to understanding the dynamics and trends affecting the sector both locally and internationally. In this detailed analysis, we address the important factors influencing energy prices, supply and demand, and the latest regulatory policies. This comprehensive overview will allow you to keep up to date with weekly changes and anticipate possible market variations, both in France and in other relevant markets such as Spain.
Table of Contents
June 2026
Key figures of the month
Source: Haya Energy Solutions
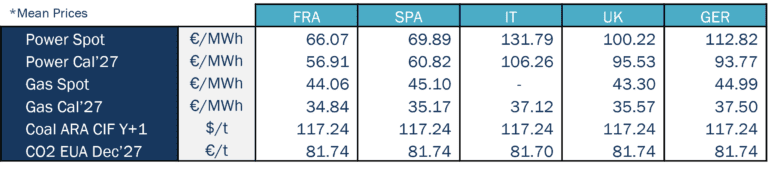
In June 2026, electricity spot prices increased across most major European markets compared with the previous month. In the forward market, Power Cal’27 remained broadly stable overall, with moderate increases in most countries and average changes of around 1 €/MWh. Overall, forward price levels shifted slightly upwards compared with those observed in May.
France and Spain remained in the lower range of monthly average electricity prices, between 65 and 70 €/MWh. France was the lowest-priced power market in the region, with an average price of 66.07 €/MWh, despite an increase of around 14 €/MWh compared with May. Spain ranked second, with an average price of 69.89 €/MWh, also up significantly, by around 20 €/MWh compared with the previous month.
By contrast, the UK, Germany and Italy all recorded average monthly prices above 100 €/MWh. Germany averaged close to 113 €/MWh, the UK remained around 100 €/MWh, and Italy stayed above 131 €/MWh. Particularly noteworthy was the increase in Germany’s monthly average price, which rose by around 20 €/MWh compared with May. Italy also recorded an increase of around 10 €/MWh, while the UK remained broadly stable relative to the previous month.
Overall, June once again highlighted the wide divergence in spot prices across Europe, with Spain and France in a 65–70 €/MWh range, while countries such as Germany and Italy remained at much higher levels, in some cases close to or above double that range.
June was also a record month for solar PV output across several major European markets. New all-time daily highs for June were reached in Germany (489 GWh), France (183 GWh) and Italy (161 GWh). In the case of Spain, the record was even more significant, as the 267 GWh reached on 26 June was not only the highest solar output ever recorded for a day in June, but also the country’s all-time daily solar generation record.
On the gas side, average spot prices remained broadly stable around the 43–45 €/MWh range across most markets. Compared with May, gas prices declined modestly across all countries. Gas Cal’27 also moved lower on a month-on-month basis across all countries.
As has been the case since the outbreak of the conflict, gas price formation remained largely driven by developments involving Iran, Israel and the United States, and, in particular, by events affecting the transit of gas and oil through the Strait of Hormuz. A more detailed review of the main developments during June and their impact on gas prices is provided in section 3.
As for CO₂, prices increased from around 79 €/t in May to 81 €/t in June, extending the upward trend observed in the previous month. June was therefore bullish on average for the carbon market, although the ceasefire agreement triggered a partial correction towards month-end.
Energy demand and generation mix
Source: Haya Energy Solutions
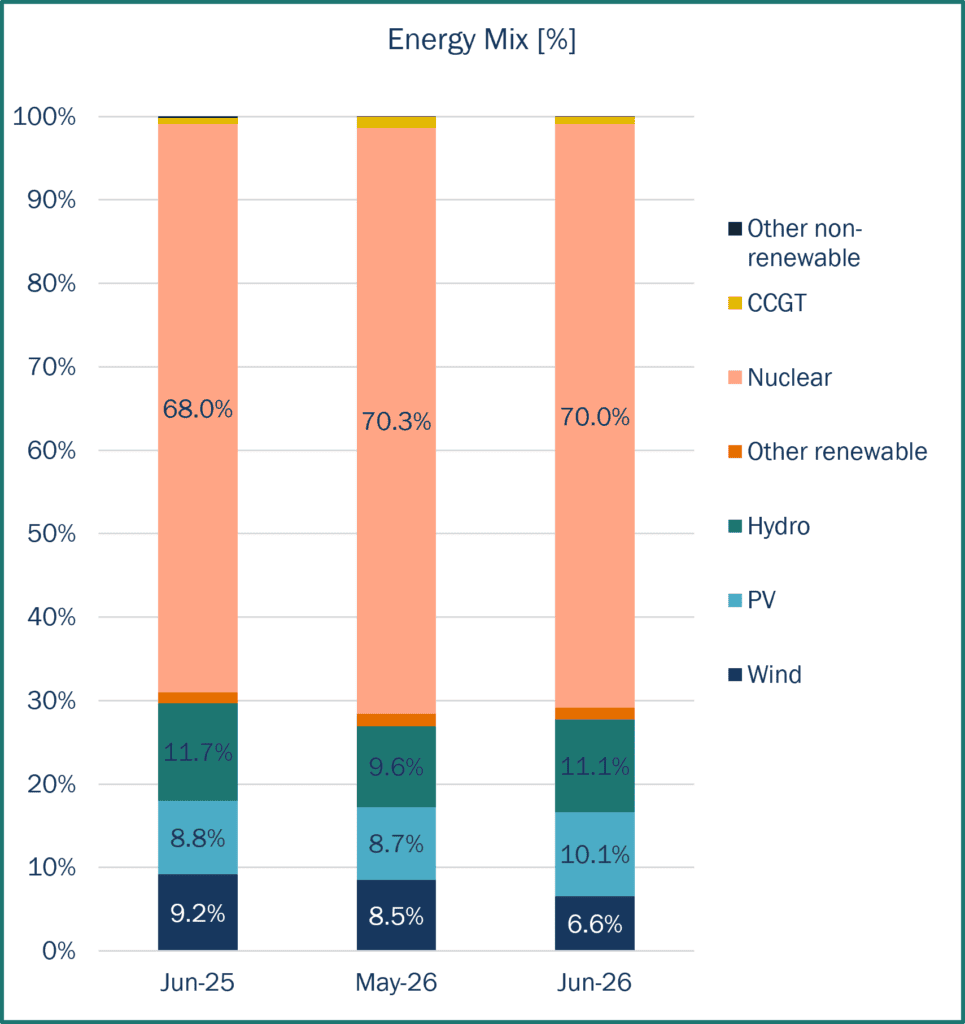
In June 2026, total generation in France reached 38,366 GWh.
Nuclear power remains the backbone of the French generation mix, playing a key role in ensuring system security of supply; it represented 69.0% of June’s energy mix. However, as temperatures moved well above seasonal norms mid-June, some nuclear plants operated at a reduced rate. Rising river temperatures triggered EDF warnings and actual environmental curtailments at plants including St Alban, Bugey, Blayais and Golfech. By late June, French nuclear curtailments reached around 6.4 GW, close to the 2019 record, forcing lower exports and more backup gas generation to cover the gap. Indeed, CCGTs participation has increased (2.4% in June vs 0.8% in May). The other main technologies have been solar PV, hydro and wind generation.
In the matter of renewable energy sources, the month began with easing sun and improved wind conditions, subsequently, high solar output was recorded around midday, but wind output was low. As you can see from the graph, solar production comes second in the total energy mix, representing a 11.3% out of the total production and first in the renewable energy category. Hydroelectric stocks have increased in the last month from 1,640 GWh at the end of May until 2,439 GWh by end June (figures until week 26 in RTE), with very low levels in comparison with the last 5 years stock level in the same period.
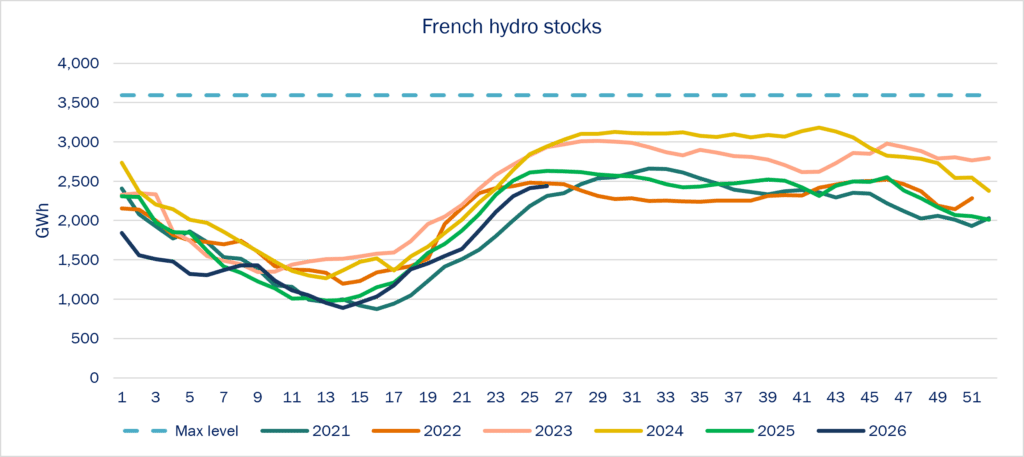
Note: Hydraulic stock represents the aggregated energy content of French lake-type hydro reservoirs, expressed as head energy (energy producible by the plant directly connected to the reservoir). Maximum stock: 3,591 GWh. Data published weekly by RTE.
Energy prices & market panorama
Power prices were mainly driven by weather and renewable volatility. The month began with easing temperatures and improved wind conditions, but this relief was short-lived as a new heatwave pushed cooling demand sharply higher across France. Weak wind output, fading solar generation in evening hours and rising river temperatures created strong price spikes, while environmental constraints on French nuclear plants added another layer of tightness.
June’s average spot electricity price in France reached 66.1 €/MWh, a 27% increase compared with May’s average of 52.2 €/MWh. As shown in the graph, prices fluctuated significantly throughout the month, with a minimum quarterly price of -53.0 €/MWh on 13 June and a maximum of 433.4 €/MWh on 24 June. Day-ahead prices frequently dropped to very low or near-zero levels around midday, with 25 % of hours below 5 €/MWh, reflecting the increasing impact of solar generation. In contrast, peak hours experienced sharp price spikes, with 21 % of hourly prices above 120 €/MWh, likely reflecting periods when gas-fired generation was setting the marginal price.
In terms of cross-border flows, France remained a net exporter across most interconnections. Hourly export levels exceeded 18 GW at peak during the month.

Source: Haya Energy Solutions
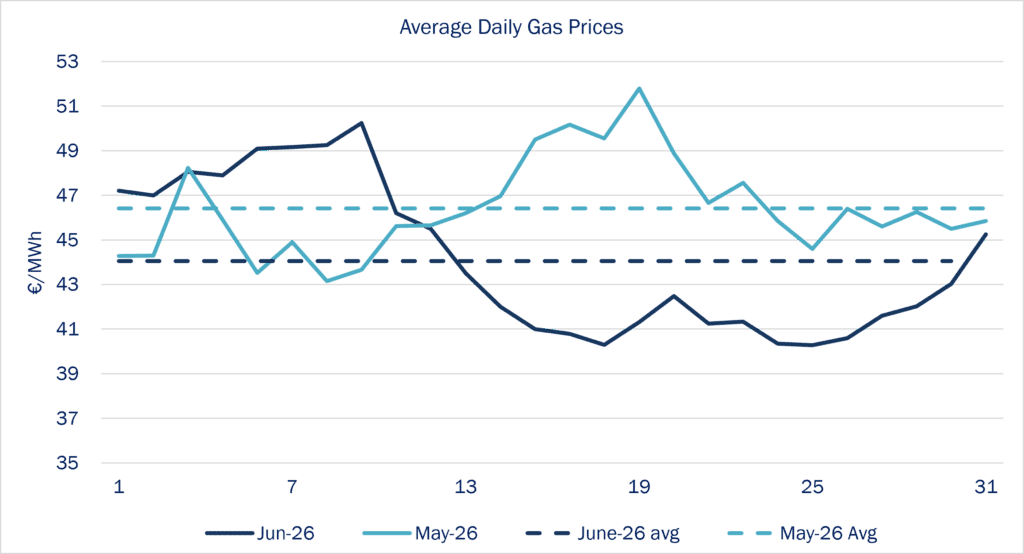
Regarding the PEG Day Ahead spot price, throughout June, spot prices averaged 44.1 €/MWh, decreasing by 5% compared to May 2026, with prices ranging between 40.3 €/MWh and 50.2 €/MWh. As can be seen from the graph, prices in June remained above those of May during the first half of the month, and the trend reversed in the second half of the month, before increasing towards the end of the month.
Source: Haya Energy Solutions
Gas prices benefited from the easing of geopolitical tensions, but the market remained structurally uncomfortable. The prospect of a US–Iran deal and the reopening of Hormuz helped unwind part of the premium, yet French and European fundamentals did not materially improve: storage levels remained low, LNG flows were still under pressure, and injections were not strong enough to close the gap versus last year. In the second half of the month, stronger gas demand for power generation, driven by weak wind and higher cooling demand, limited further downside and kept spot prices supported.
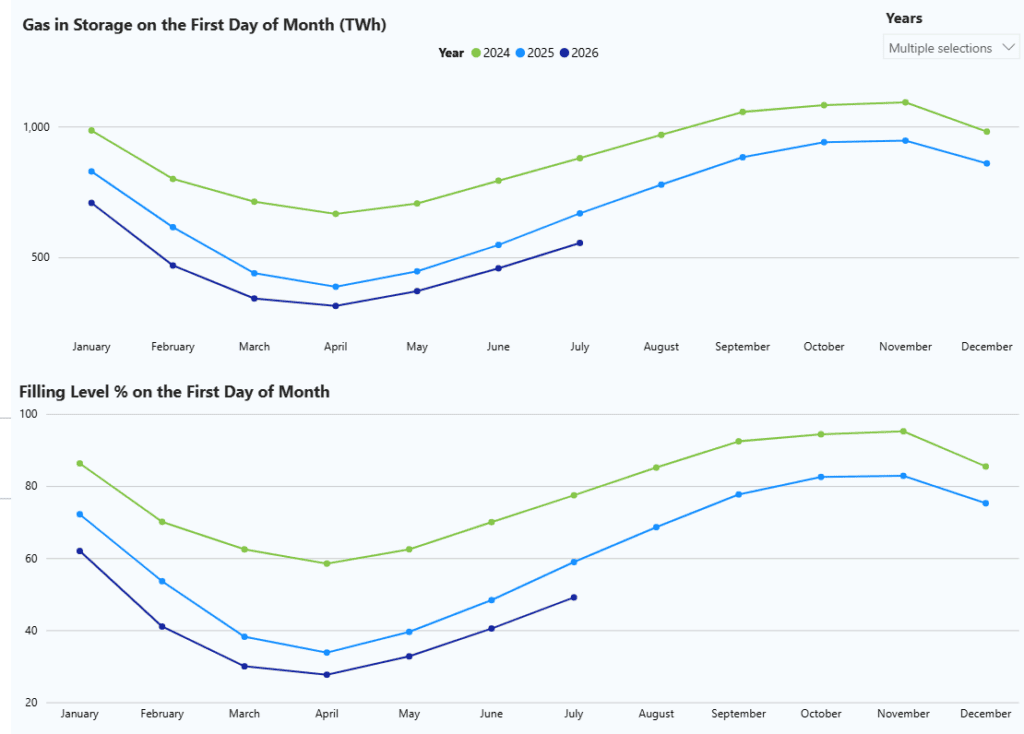
EU gas stocks finished June at 48.9% full on average, still below the 58.6% recorded at the same point in 2025. This gradual refill reduced some immediate pressure, but the storage deficit remains a key bullish risk ahead of next winter. For France, this means that PEG prices are likely to remain sensitive to LNG availability, Norwegian supply, Asian demand and any renewed geopolitical escalation.
Market trends and futures
Source: Haya Energy Solutions
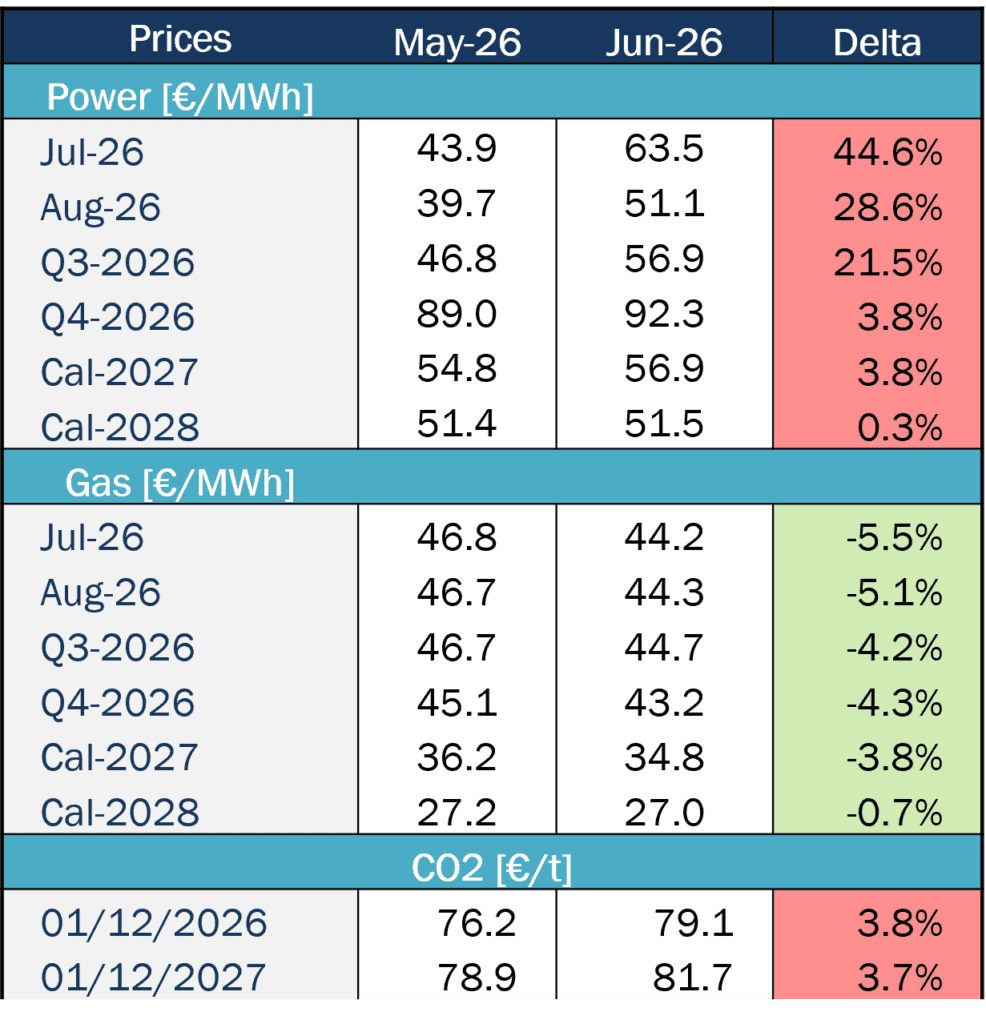
During June, French power futures showed an upward trend compared with May average prices, with the forward curve also rising throughout the month. Short-term products, including Jul-26, Aug-26 and Q3-2026, increased over the month. This upward move reflected growing concerns around the summer balance, including higher cooling demand, weaker hydro conditions, river-related nuclear constraints and higher gas prices. Q4-2026 also increased by 3.8% to 92.3 €/MWh, while longer-dated contracts remained broadly stable, with Cal-2028 up 0.3% to 51.5 €/MWh.
Gas forwards in June decreased compared with May forwards, while also showing mixed movements throughout the month. Short-term contracts decreased by around 5% on average, whereas longer-dated products were more stable. Gas prices benefited from the easing of geopolitical tensions, but the market remained structurally uncomfortable: storage levels remain low, LNG flows are still under pressure, and injections are not strong enough to close the gap versus last year.
Carbon markets remained caught between policy support and industrial resistance. On the supportive side, the Commission’s planned ETS review, the proposed €30bn “ETS Investment Booster” and the strengthening of ETS2 price-stability tools reinforced the role of carbon markets in EU decarbonisation financing. However, the upcoming EU ETS review could reshape free allowances, industrial decarbonisation funding and the extension of carbon pricing to new sectors. France, alongside Germany, is pushing for more flexible “case-by-case” adjustments to protect industrial competitiveness, while French industry remains sensitive to higher carbon costs in a weak economic environment EUA Dec-2026 increasing by 2.8% (76.2 €/t).
Oil markets shifted from acute supply-risk pricing to a faster-than-expected unwinding of the geopolitical premium. At the start of the month, the blockage of the Strait of Hormuz kept physical constraints severe, with only a fraction of normal Gulf tanker flows escaping and several vessels reportedly hit. However, by late June, the resumption of vessel transits with AIS signals switched back on signalled a clear decline in risk perception, allowing Brent to slide back toward the mid-$70s despite still-fragile logistics.
Key news and implications
Europe’s gas storage situation remains the main structural vulnerability ahead of winter. Europe would need around 70 bcm of LNG between May and October to refill storage at the same pace as last year, but this target looks difficult because the region entered the injection season with a significant delay versus 2025. The central scenario is therefore materially weaker: storage could reach only around 70% by 1 November, well below the historical 90% winter-security benchmark usually associated with comfortable security of supply. This means that even if regulatory flexibility allows lower targets in exceptional circumstances, Europe would still enter winter with a thinner safety buffer than usual.
Source: Entsog
The key issue is that global LNG supply may not be able to fully compensate for lost or reduced Gulf flows. Qatar and the UAE account for almost 20% of global LNG trade, and any disruption from that region would only be partly offset by additional supply from North America, Russia, Congo or Mexico. Lower Asian LNG demand has helped ease the market so far, especially as China, Japan, South Korea and India have reduced imports, sometimes switching back toward coal. But this relief is fragile: a rebound in Asian cooling demand during summer could quickly tighten global LNG balances again, leaving Europe competing harder for cargoes precisely when it needs to accelerate injections.