Key Insights from the French Market Analysis
Analysis of the French energy market is key to understanding the dynamics and trends affecting the sector both locally and internationally. In this detailed analysis, we address the important factors influencing energy prices, supply and demand, and the latest regulatory policies. This comprehensive overview will allow you to keep up to date with weekly changes and anticipate possible market variations, both in France and in other relevant markets such as Spain.
Table of Contents
September 2026
Key figures of the month
Source: Haya Energy Solutions
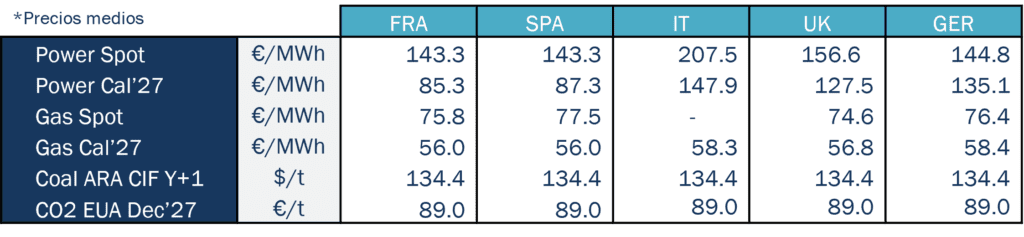
In September 2026, electricity spot prices increased sharply across all major European markets. The upward movement was even more pronounced in the forward market, with Power Cal’27 rising across all countries, largely supported by higher gas prices. Month-on-month increases ranged from c.15 €/MWh in Spain to c.27 €/MWh in Germany, representing a significant repricing over the course of a single month. This broader increase in energy costs also contributed to renewed inflationary pressures in Europe, particularly through higher electricity and fuel prices.
Spain, France and Germany remained in a lower range of monthly average electricity prices, at around 143–145 €/MWh. However, all three markets recorded significant increases compared with August, ranging from approximately 18 €/MWh in Germany to 25 €/MWh in Spain.
By contrast, the UK recorded an average monthly price of around 157 €/MWh, although it experienced the smallest month-on-month increase among the markets analysed. Italy once again stood out as the highest-priced market, averaging around 208 €/MWh, and also recorded the largest monthly increase, rising by approximately 28 €/MWh compared with August.
September also saw new daily solar PV generation records across several major European markets. New highs for a September day were reached in Germany (389 GWh), Spain (267 GWh), France (158 GWh), and Italy (143 GWh). Wind generation, meanwhile, showed significant week-to-week volatility across Europe, becoming an important driver of electricity price movements during the month.
On the gas side, average spot prices stood broadly within the 74–77 €/MWh range across most markets. Compared with August, gas prices increased sharply across all countries, by around 14 €/MWh on average. Gas Cal’27 also moved substantially higher on a month-on-month basis across all markets, with increases of more than 12 €/MWh in each case.
As for CO₂, prices increased from around 85 €/t in August to 89 €/t in September, extending the upward trend observed over recent months. The increase was supported by the broader bullish environment across energy markets, particularly higher gas and power prices. Overall, September was characterised by broad-based upward price pressure across the main energy commodities.
Energy demand and generation mix
Source: Haya Energy Solutions
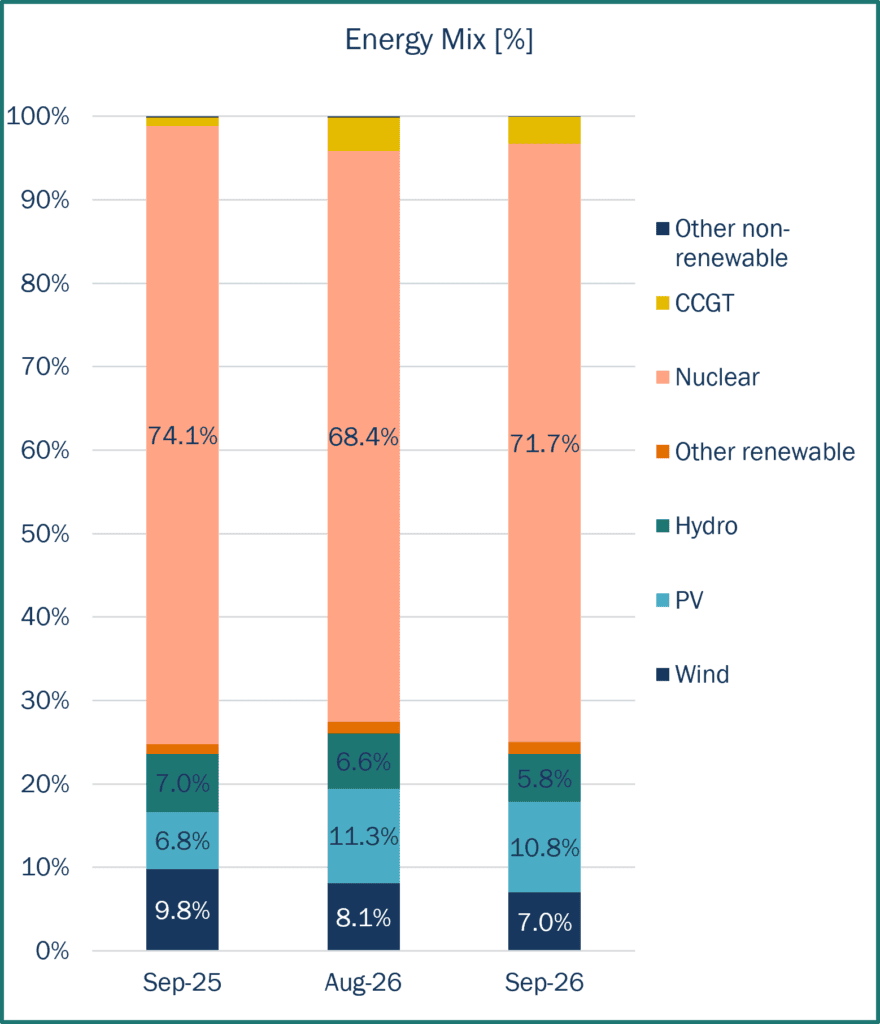
In September 2026, total generation in France reached 35,811 GWh.
Nuclear power remains the backbone of the French generation mix, playing a key role in ensuring system security of supply; it represented 71.7% of September’s energy mix. However, environmental restrictions and numerous outages meant that the underlying balance remained tighter than usual. The other main technologies have been PV, wind and hydro. CCGT generation decreased from 4.0% in August to 3.2% in September.
Regarding renewable energy sources, the overall contribution was broadly aligned with the previous month. Solar PV was the largest renewable contributor, accounting for 10.8% of total generation. It was followed by wind generation (7.0%) and hydropower (5.8%). Hydroelectric stocks have decreased in the last months, reaching a critical point, from 2,073 GWh at the end of August until 1,840 GWh by end September (figures until week 39 in RTE), with very low levels in comparison with the last 5 years stock level in the same period.
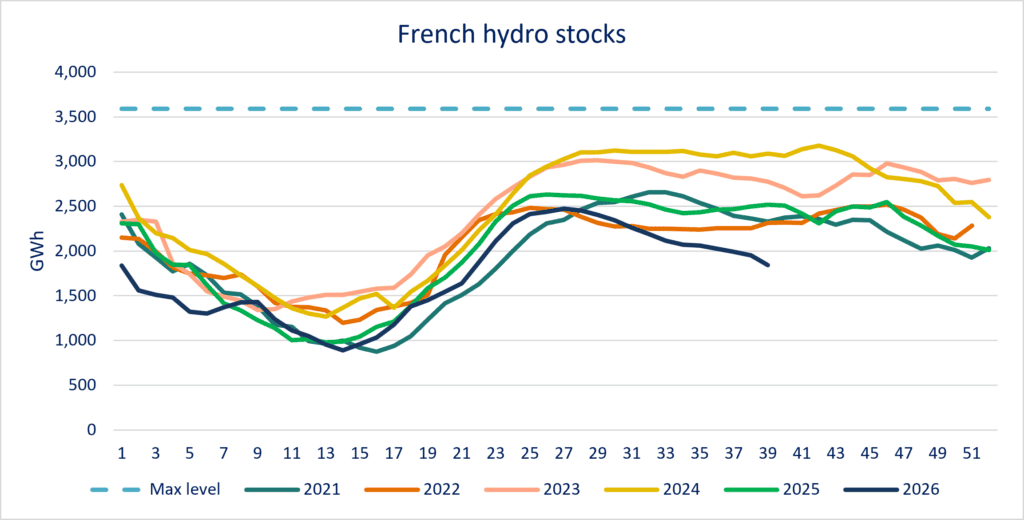
Note: Hydraulic stock represents the aggregated energy content of French lake-type hydro reservoirs, expressed as head energy (energy producible by the plant directly connected to the reservoir). Maximum stock: 3,591 GWh. Data published weekly by RTE.
Energy prices & market panorama
French power market entered September on a bullish footing, with prices supported by warm weather, rising gas prices and constrained nuclear availability, initially around 40 GW. Dry conditions, weak hydro output and extensions to nuclear outages, notably at Chooz and Belleville-2, tightened the balance further and pushed front-month prices higher despite strong solar generation. By mid-month, tightness intensified as nuclear strikes removed more than 6 GW of capacity, reducing availability to around 34 GW. Combined with persistent outages and high gas prices, this kept spot prices elevated, while exceptionally weak hydro generation emerged as an additional source of risk. The supportive backdrop persisted into month-end, with exceptionally warm and dry weather, low hydro and limited wind sustaining spot prices and volatility. Low river levels increasingly constrained nuclear generation, with the Chooz outage extended into October and Civaux also at risk. With temperatures still 5–7°C above seasonal norms, French power avoided the late-month easing seen in oil and gas, remaining structurally supported by tight generation availability and weather-related constraints.
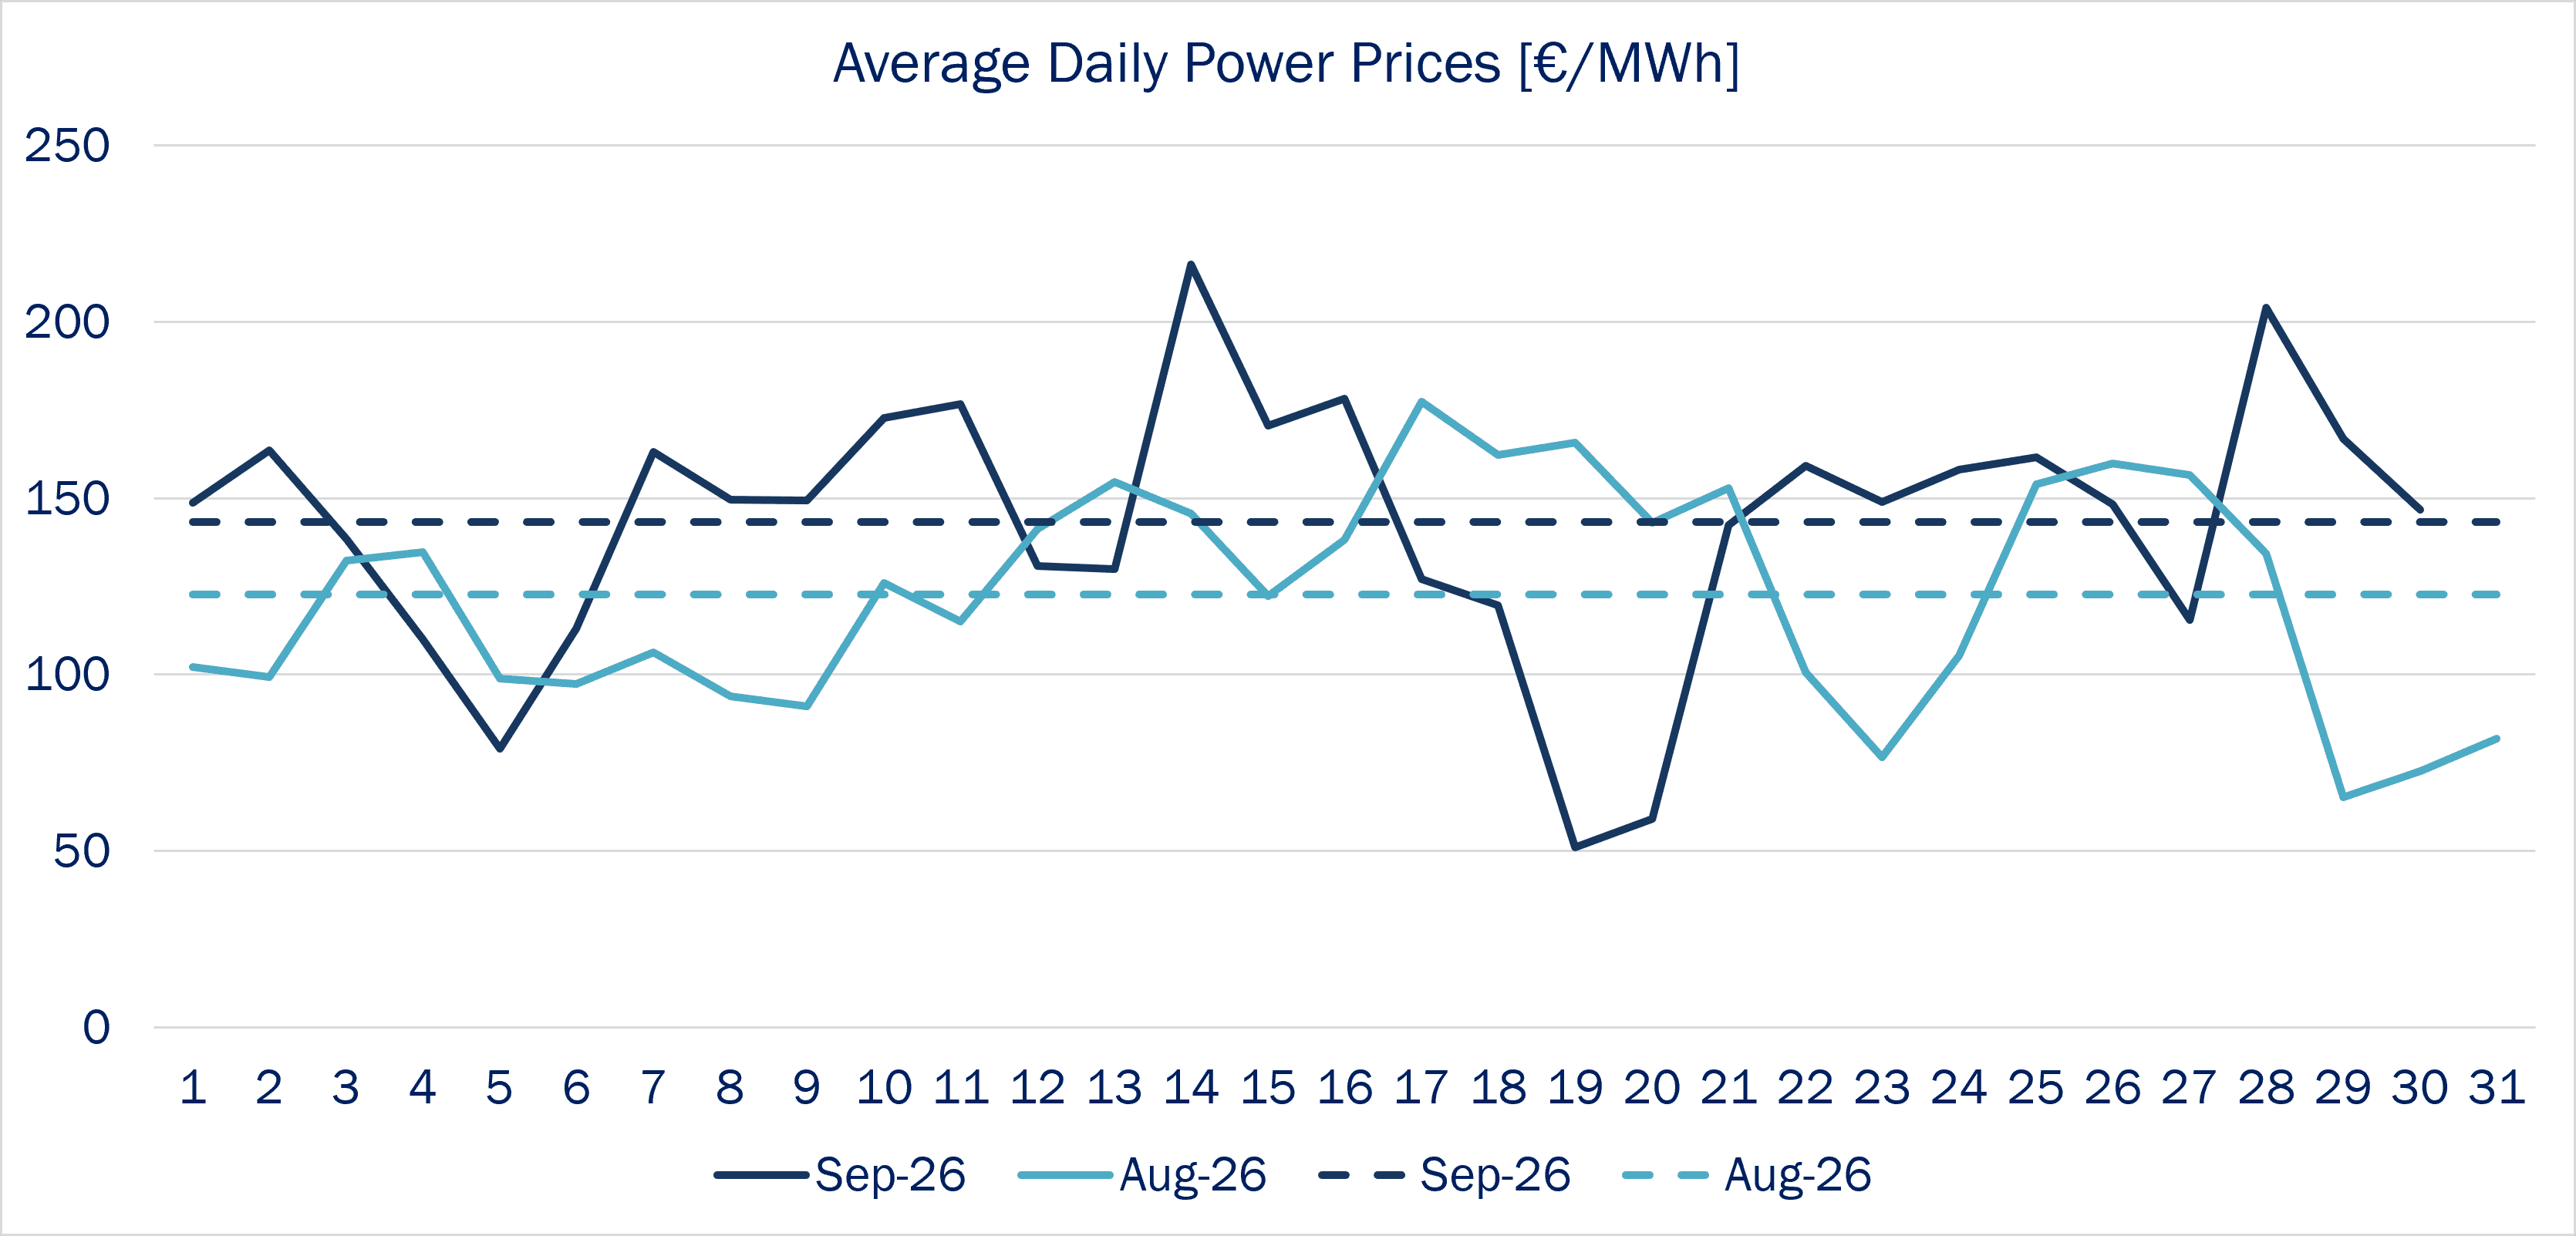
September’s average spot electricity price in France reached 143.3 €/MWh, a 17% increase compared with August’s average of 122.8.2 €/MWh and 311.7% above September 2025. As shown in the graph, prices fluctuated significantly throughout the month, with a minimum quarterly price of -2.0 €/MWh on 27th September at 13.45 pm and a maximum of 390.6 €/MWh on 28th September at 18 pm.
Low-price hours became less frequent than in August, with 8.0% of prices below €5/MWh, compared with 12.3% in August. In contrast, high-price periods maintained the same level, with 68.5% of prices above €120/MWh, compared with 68.0% in August.
In terms of cross-border flows, France remained a net exporter across most interconnections. Hourly export levels reached c. 16 GW at peak during the month.
Source: Haya Energy Solutions
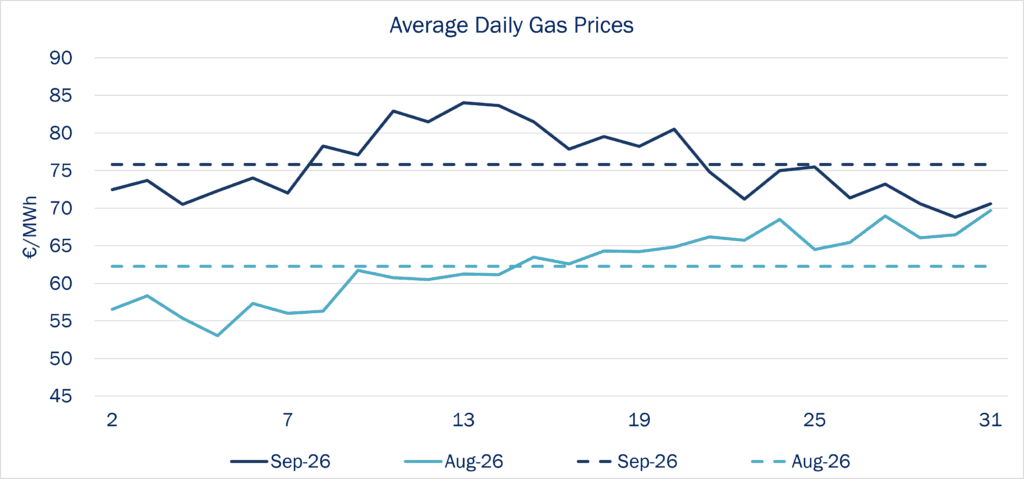
Regarding the PEG Day-Ahead spot price, September 2026 prices averaged €75.8/MWh, increasing by 21.7% compared with August’s average of €62.3/MWh, with daily prices ranging between €68.8/MWh and €84.0/MWh throughout the month. As shown in the graph, prices remained relatively firm throughout the month and strengthened particularly during the middle of September.
Source: Haya Energy Solutions
European gas prices started September with a sharp rise across both spot and forward markets as renewed US-Iran military activity restored the geopolitical risk premium. The bullish move was reinforced almost immediately by lower Norwegian supply, with unplanned outages at Kollsnes and Troll reducing flows while European storage provided little comfort. Reduced traffic through Hormuz following attacks on tankers added a further LNG-supply risk, keeping the market sensitive to any escalation in the Middle East. Then, Norwegian production recovered somewhat, but weaker LNG send-outs prevented a meaningful improvement in storage injections. At the same time, escalating regional security risks, including the Houthi seizure of the Yemeni port of Mocha and reduced traffic through Hormuz, maintained a risk premium in gas prices. The balance began to soften around mid-month, however, as sharply lower residential, commercial and power-sector demand improved the prospect of stronger storage injections. By the third week, fundamentals had become noticeably less bullish. Norwegian supply rebounded, demand declined and European storage injections increased. The more decisive bearish factor arrived around 22 September, when the market increasingly priced in hopes of a diplomatic route toward de-escalation between the US and Iran. The month therefore evolved from a strong geopolitical- and supply-driven rally toward softer pricing later in September as demand weakened, Norwegian flows improved and the geopolitical premium began to recede.
EU gas stocks ended September at around 71.6% full, well below the 82.5% recorded at the same time in 2025. This persistent storage deficit, together with uncertainties around LNG and Norwegian supply, leaves PEG prices particularly sensitive to further supply disruptions, weather conditions and competition with Asia for LNG ahead of winter. France itself was around 83.8% full at the end of the month.
Market trends and futures
Source: Haya Energy Solutions
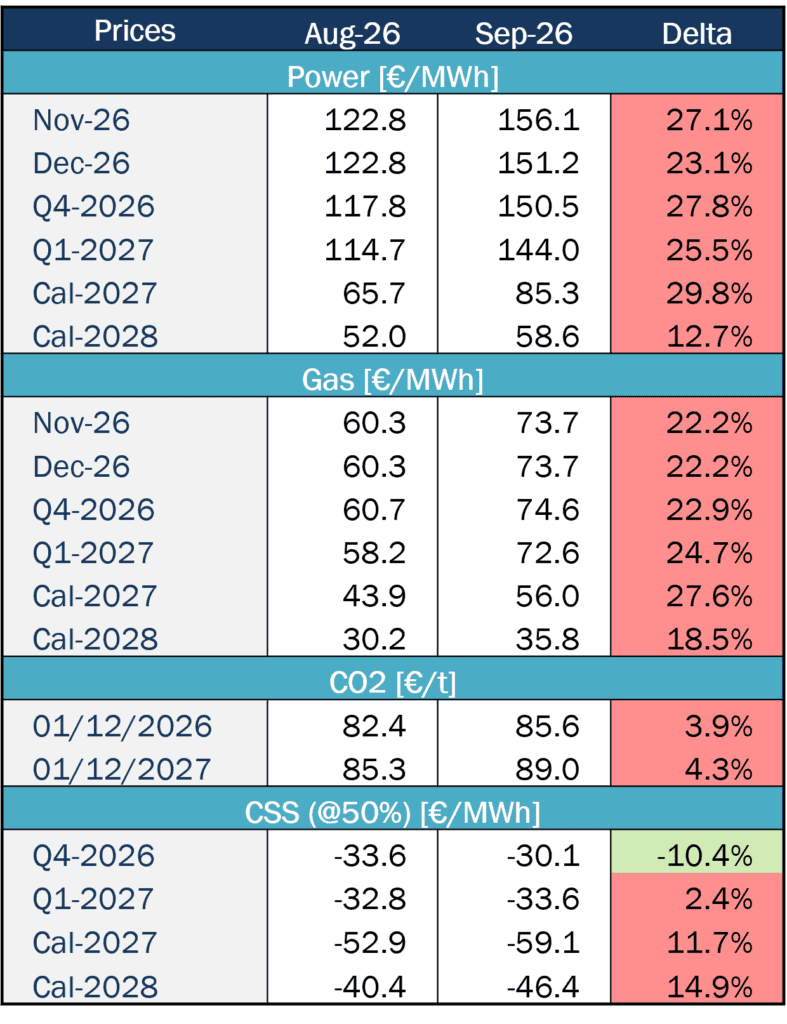
During September, French power futures moved higher across the curve, with the strongest increases concentrated in the long-term products (CAL-27 +29.8%). By 14 September French Cal-27 had moved above €90/MWh, levels not seen since late 2023.This suggests that the repricing was mainly driven by near-term winter supply concerns rather than by a structural change in the long-term French power outlook.
Gas forwards rose across the curve, with short-term contracts increasing by around 22-25%. European gas markets remain exposed to low storage levels, LNG availability and geopolitical risks, all of which have increased the risk premium ahead of winter. This gas rally fed directly into French power forwards because gas-fired generation often sets the marginal electricity price when nuclear or renewable availability is lower. In those periods, higher gas prices translate into a higher marginal power price, especially during peak-demand hours or when renewable output falls. This dynamic became particularly relevant over the summer and September, when lower nuclear flexibility and the evening decline in solar generation increased the need for flexible thermal generation.
Carbon prices remained comparatively stable, with only modest increases across the curve. This indicates that the recent move in French power prices was driven primarily by gas and winter supply concerns, rather than by a significant repricing of carbon.
Oil: disruption risks around the Strait of Hormuz remained the dominant driver, compounded by unusually high global refinery outages and Russia’s extended diesel export ban. The market tightened again during the first half of the month as the supply risk broadened beyond Iran. Houthi attacks affected Saudi energy infrastructure, Saudi production and observed exports fell sharply, and both the Hormuz and Red Sea routes became increasingly difficult. However, the direction reversed into month-end as physical Middle Eastern flows recovered significantly. By 30 September, regional crude exports were estimated at almost pre-war levels and Hormuz flows had largely normalized. Overall, September therefore moved from escalating supply-risk premium and tightening physical availability toward a late-month correction as actual export flows recovered.
Key news and implications
Capacity mechanism
On 25 September 2026, the CRE proposed the economic criteria governing eligibility for multi-year contracts under the French capacity mechanism. Eligible investments must qualify as capital expenditure, be necessary for the project, fall within the defined investment period, and must not have reached final investment decision before the auction results. Contract duration would be left to market participants, subject to accounting amortisation limits and maximum durations by investment type.
The implementation timetable remains uncertain, as further ministerial orders are still required before multi-year contracts can be fully integrated into capacity auctions. This makes their inclusion in the PL-4 auction for 2030-2031 delivery appear difficult, despite RTE having opened the prequalification process. A further uncertainty concerns very long contracts, as the European Commission’s approval of the mechanism only runs from November 2026 to November 2036.