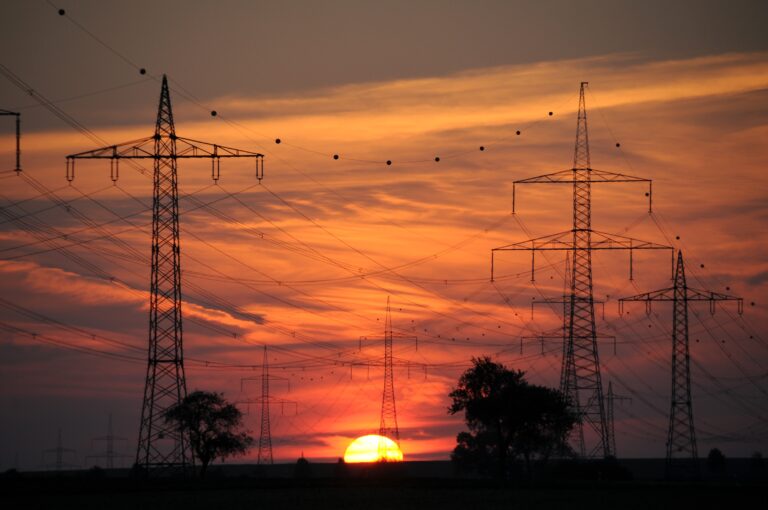
European electricity markets are evolving rapidly, and this transformation is directly reflected in the evolution of hourly price curves. Price formation is no longer driven solely by seasonal demand cycles; it increasingly depends on renewable generation profiles, flexibility constraints, and short-term scarcity events. This shift has created a growing need for forecasts at a much finer level of granularity. Annual averages still retain strategic value, but it is now hourly curves that drive trading, hedging, storage optimisation, and asset valuation.
The rise of solar PV and wind power has profoundly reshaped the balance between supply and demand. Power systems are now experiencing recurring periods of surplus when renewable generation is abundant, followed by tighter conditions when output declines. These alternations generate greater intraday volatility as well as a higher frequency of very low — or even negative — price hours, particularly in countries with high solar penetration. Since October 2025, this trend has also been reflected in the introduction of spot market pricing on 15-minute intervals.
At the same time, market coupling and cross-border flows are contributing to a partial convergence of price trends across Europe. However, local constraints such as grid congestion, interconnection limitations, and shortages of flexibility resources continue to strongly influence country-specific price profiles. Understanding and anticipating these hourly curves has therefore become a central element of modern power market analysis.
Forecasting an hourly curve means projecting, hour by hour, the system fundamentals: generation, demand, residual load, interconnection availability, and prices. This approach makes it possible to capture the intraday structure of the market, which has become increasingly important as renewable energy sources shape the marginal pricing dynamics.
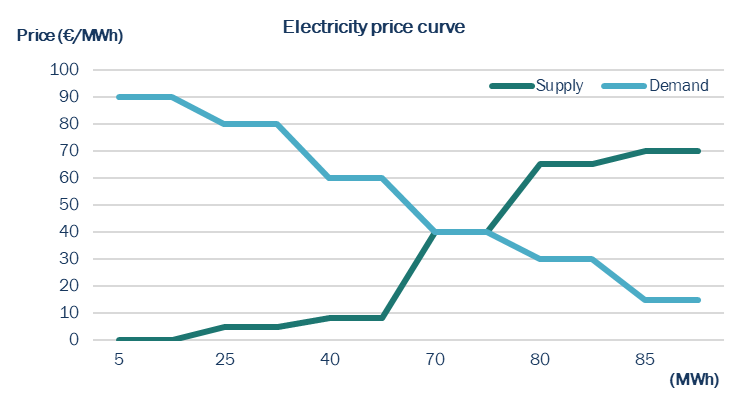
Analysts examine production and consumption profiles by identifying peak and off-peak periods, as well as the moments when solar and wind generation reach their maximum output. They also rely on the key concept of residual demand — the share of demand not covered by renewables. They then assess the available flexibility capacities: dispatchable generation, storage, and imports. Comparing these curves reveals periods of surplus or deficit and helps identify which technology sets the marginal price.
Building on the previous example, supply is now represented according to the technologies available within the energy mix. In this context, dispatchable sources play a crucial role in influencing prices when residual demand exceeds supply, particularly when demand cannot be met by non-dispatchable renewable energy sources.
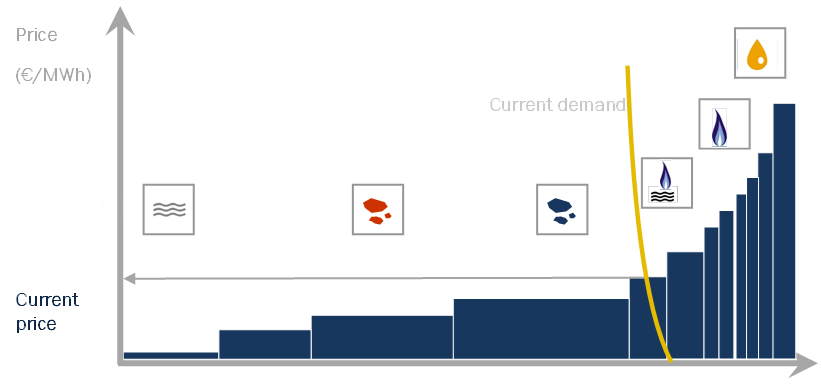
Each technological mix leaves a distinct “shape” on the price curve.
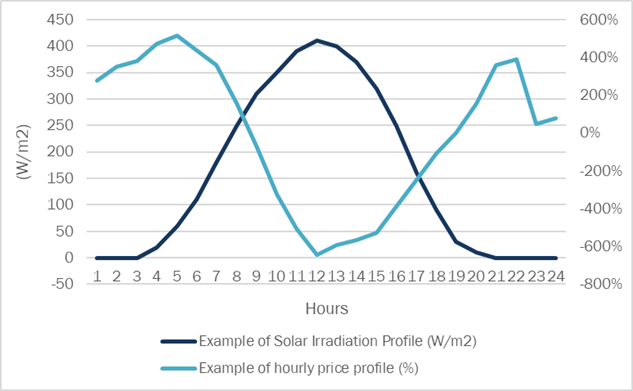
- Photovoltaic generation: in Spain, the high penetration of solar PV creates a production peak around midday. Prices therefore fall during the middle of the day before rising sharply again in the evening, when solar generation declines while demand remains high. This configuration gives rise to the well-known “duck curve” in residual demand.
- Wind generation: wind production, being more intermittent, introduces significant variability. In France, where wind capacity is substantial, price fluctuations can vary strongly from one day to another, increasing uncertainty and volatility.
- Battery storage: batteries help reduce volatility by charging during periods of renewable surplus and low prices, then discharging during peak-demand hours. As storage deployment increases, price extremes can be partially mitigated, reducing the frequency of negative prices and softening evening price spikes.
- Nuclear power: the French nuclear fleet provides a stable baseload supply, which smooths intraday price fluctuations compared to Spain, where marginal pricing is more exposed to changes in gas and solar generation.
Hourly electricity prices are fundamentally determined by the balance between hourly demand levels, available renewable generation, and the marginal dispatchable technology (gas, coal, imports).
During peak consumption periods, such as mornings and evenings, demand generally rises while solar generation may be limited. This leads to greater reliance on gas-fired power plants, resulting in higher prices. Conversely, during periods of strong renewable generation — midday in Spain or windy nights in France marginal costs decline, sometimes even leading to negative prices when system flexibility is insufficient.
A high share of renewable energy sources leads to lower midday prices. However, it also introduces greater volatility and sharper price spikes: solar power depresses midday prices, while wind power increases volatility due to its unpredictability and can also lower nighttime prices. Greater dependence on gas results in higher electricity prices.
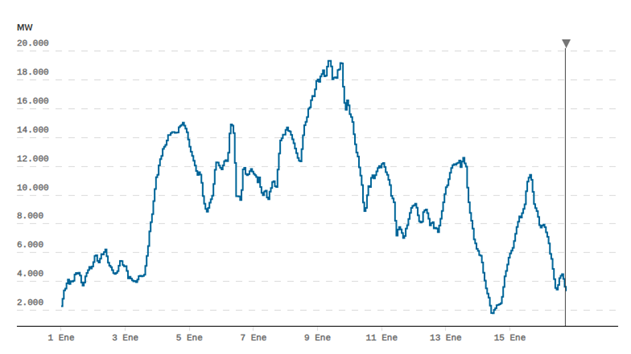
Greater storage penetration contributes to a smoother price curve.
Residual demand plays a central role here. Defined as total demand minus non-dispatchable generation, it explains midday price troughs, evening peaks, and intraday spreads. It directly links renewable generation dynamics to price formation.
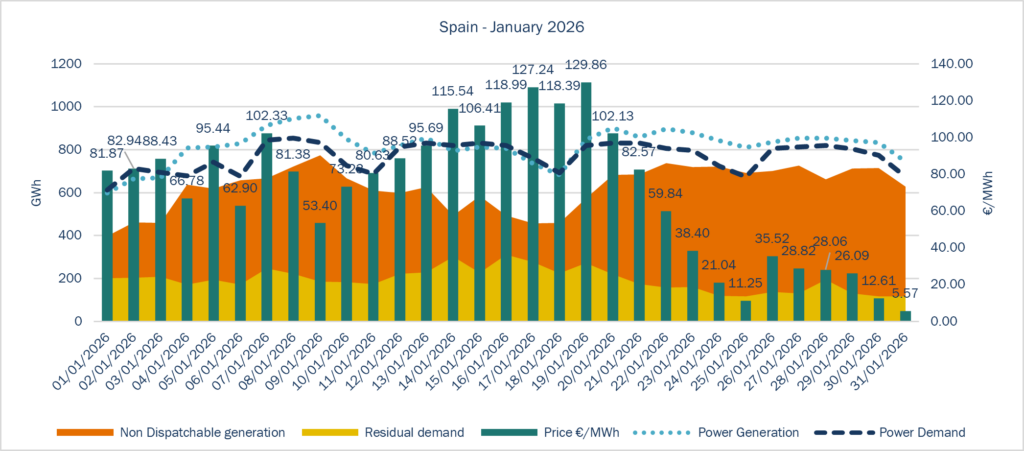
Consequently, one of the main structural drivers shaping hourly price curves is the composition of the generation mix, the penetration and cannibalisation effects of renewables, the availability of flexibility resources (storage, hydropower, demand response), cross-border interconnections, fuel and CO₂ cost pass-through, and market design features (including price caps and balancing rules).
Depending on these parameters, a market may display a smooth price baseline or, conversely, strong volatility marked by sharp spikes and negative price episodes.
To define different forecasting scenarios, several considerations are therefore taken into account for each possible outlook:
- Short term (ST, days to weeks): used for spot trading, dispatch optimisation, and balancing strategies.
- Medium term (months to 1 year): useful for hedging structures, forward curve shaping, and asset revenue forecasting.
- Long term (LT, multi-year): essential for investment decisions, PPA pricing, and long-term capacity evolution modelling.
These scenarios incorporate uncertainties related to weather conditions, outages, fuel prices, and regulatory developments. The impact on P&L is direct. Budgets are often based on annual averages, but actual performance depends on hourly capture prices:
- A solar asset may underperform if midday prices decline due to market cannibalisation.
- A flexible gas-fired plant may outperform if spreads widen.
- Storage profitability partly depends on intraday volatility.
As a result, accurate hourly forecasting is essential to minimise budget deviations, optimise hedging strategies, and protect company P&L against unexpected market shifts.
At HES, we develop our own price curve scenarios based on statistical analyses aligned with current market fundamentals. Since each country presents distinct characteristics, our scenarios are tailored accordingly, integrating intraday peaks, renewable penetration, commodity influence, and residual demand dynamics across each time horizon.
Cheyenne Rueda Lagasse