1. Negative electricity prices: an increasingly common phenomenon
Negative electricity prices emerge when the supply of electricity exceeds demand, causing the wholesale market price to fall below zero. This means that generators exposed to the spot price must effectively pay to continue injecting power into the grid. Nevertheless, production can remain economically viable when plants are subject to high cost due to shutdown and restart activities, technical operating constraints, or when contractual and support revenues are sufficient to compensate for negative market prices.
Negative electricity prices have evolved from occasional events into a structural feature of European power markets. However, their frequency and depth differ considerably between countries. France, Germany and Spain show that renewable penetration alone does not determine the market outcome: producer incentives and system flexibility are equally important.
2. Why do electricity prices fall below zero?
Negative electricity prices do not mean that electricity has no value in general. In fact, they indicate that producing an additional megawatt hour of electricity in a specific place and at a specific time incurs a cost for the system.
The starting point is usually a combination of weak demand and high renewable output. Demand is typically lower on weekends, public holidays, and during the mild spring months, while solar generation peaks around midday. Strong wind conditions can add further supply.
As renewable production increases, the residual demand for conventional generators falls considerably. In some hours, solar and wind generation may cover most demand, pushing wholesale prices towards zero.
However, not all generators can adjust their output quickly. For example, nuclear, coal and other thermal power plants are subject to minimum generation levels, technical constraints, and significant shutdown and restart costs. Consequently, a plant may prefer to continue operating and offer a negative price if stopping production would be more costly.
Similarly, renewable generators may continue production when revenues from support schemes, certificates or contractual arrangements compensate for a negative spot price. However, support frameworks differ considerably, and some new schemes suspend or limit remuneration during prolonged negative price periods.
Negative prices become more severe when surplus electricity cannot be exported or absorbed because interconnection capacity is saturated, internal grid constraints limit power flows, and available storage or demand response is insufficient. Together, these factors determine whether prices only approach zero or drop significantly into negative figures..
3. More negative hours, but not the same negative prices
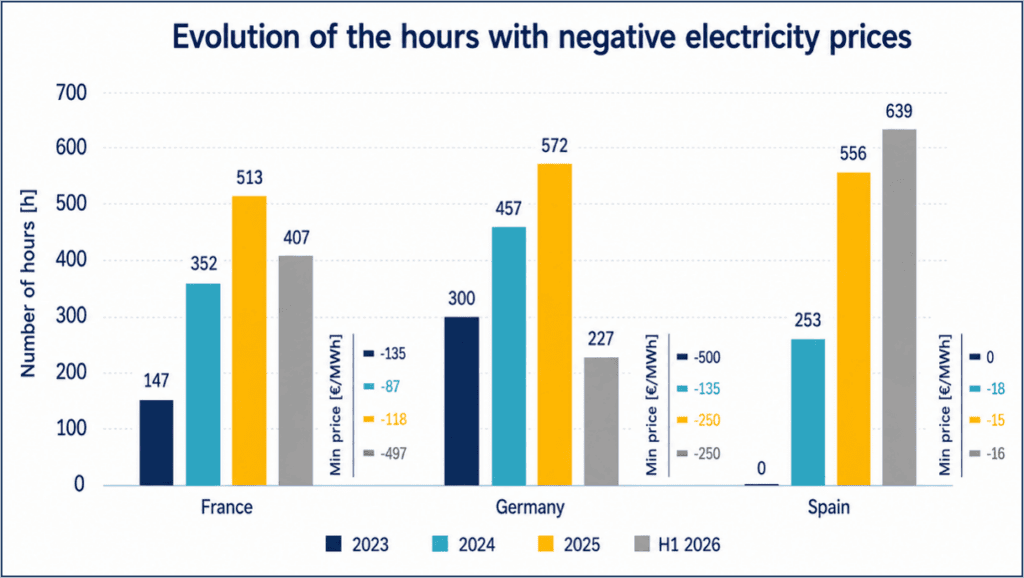
- Evolution since 2023
The increasing frequency of negative electricity prices is clearly visible in France, Germany, and Spain. France increased from 147 hours with negative prices in 2023 to 513 hours in 2025, while Germany rose from 300 hours to 572 hours. Spain experienced the most significant change, recording no negative hours in 2023, 253 in 2024, and 556 in 2025.
However, frequency alone does not capture the severity of the phenomenon. This was particularly evident in 2025, when Germany and Spain registered almost the same number of negative hours (572 and 556, respectively), but very different levels of magnitude. Germany’s minimum price was -250.32 €/MWh, with 13 hours falling below -100€/MWh. By contrast, Spain’s minimum price was only -15€/MWh. France also exceeded 500 negative hours, but its minimum price stood at -118.01 €/MWh.
- Acceleration during the first half of 2026
The first half of 2026 reinforced these differences, although the acceleration was not uniform. By the end of June, Spain had already surpassed its full-year total for 2025, reaching 639 hours of negative prices. France accumulated 407 hours, equivalent to around 9% of all hours during the period, while Germany recorded approximately 227 hours.
The distinction between frequency and depth of negative prices is therefore essential: Spain stands out for the number of negative-price hours, while France and Germany have experienced considerably deeper price troughs. The events of 1 May 2026 provide a particularly clear example of why comparable market conditions can produce such different outcomes.
4. Same conditions, different price signals: 1 May 2026
On 1 May 2026, Spain, France and Germany faced broadly comparable market conditions. It was a public holiday in all three countries, electricity demand was lower than usual and solar generation was high during the central hours of the day. Despite these similarities, their price outcomes were significantly different.
Spain’s minimum price remained close to zero, while Germany fell to around -250€/MWh and France approached -500€/MWh. The comparison illustrates how remuneration schemes, generation flexibility, interconnection capacity and producer behaviour shape the depth of negative prices.
- Spain: stronger exposure to the market signal
Spain’s price profile is increasingly shaped by solar PV, producing a pronounced midday trough followed by a rapid increase in prices during the evening. As photovoltaic generation rises, the residual demand to be covered by other technologies falls, pushing prices towards zero. After sunset, the system must replace solar output within a short period, increasing the contribution of hydropower, combined-cycle gas turbines and imports and widening the spread between midday and evening prices.
However, the most relevant feature of the Spanish market is not simply the size of its solar fleet, but the exposure of many producers to wholesale prices. A significant share of utility-scale photovoltaic generation sells directly into the market or operates under PPAs, giving producers a stronger incentive to reduce their market position when prices become negative.
The charts for 1 May illustrate this behaviour. The price chart shows a pronounced decline during the central hours of the day, while the generation mix chart indicates that photovoltaic output in the market decreased during the lowest-priced periods and increased again as prices recovered. The production profile therefore did not follow a purely physical solar curve. Although part of this variation may reflect forecasting, balancing or operational factors, it is consistent with some degree of response to the wholesale price signal.
This response may have helped contain the decline in prices: the daily average remained positive at 57.87€/MWh, while the minimum quarter-hourly price was only –2.10 €/MWh.
Spain’s limited interconnection capacity with France also reduces the transmission of the most extreme Central European price movements into the Iberian Peninsula. As a result, Spain often records many hours close to zero or moderately negative, but fewer episodes of exceptionally deep negative prices.
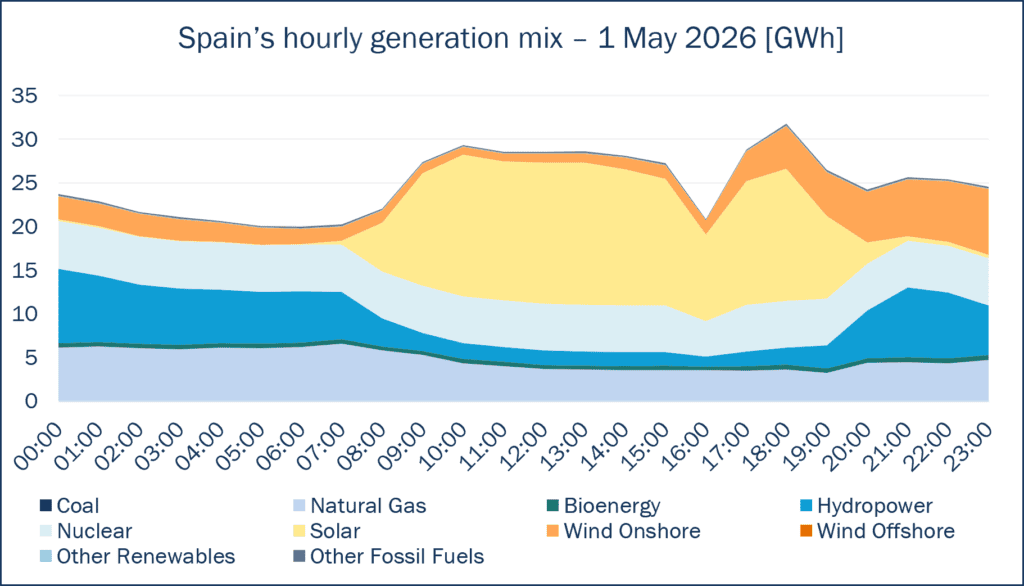
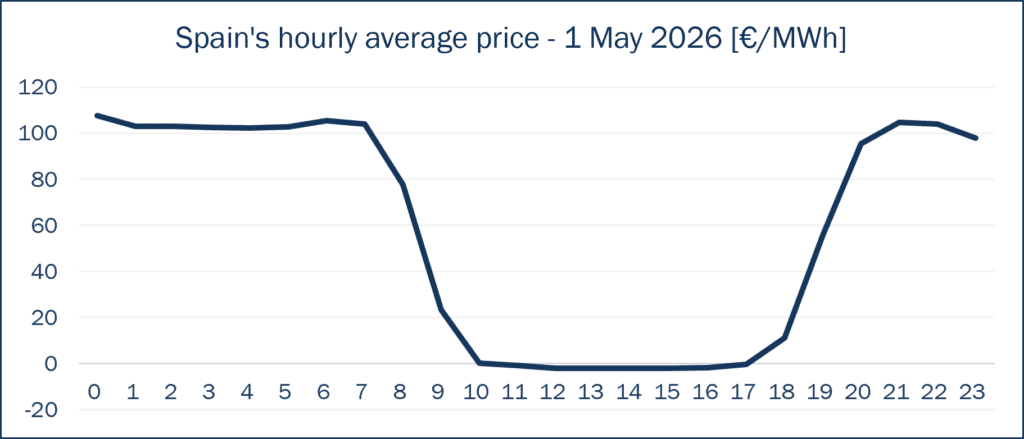
The charts for 1 May illustrate this behaviour. The price chart shows a pronounced decline during the central hours of the day, while the generation mix chart indicates that photovoltaic output in the market decreased during the lowest-priced periods and increased again as prices recovered. The production profile therefore did not follow a purely physical solar curve. Although part of this variation may reflect forecasting, balancing or operational factors, it is consistent with some degree of response to the wholesale price signal.
This response may have helped contain the decline in prices: the daily average remained positive at 57.87€/MWh, while the minimum quarter-hourly price was only –2.10 €/MWh.
Spain’s limited interconnection capacity with France also reduces the transmission of the most extreme Central European price movements into the Iberian Peninsula. As a result, Spain often records many hours close to zero or moderately negative, but fewer episodes of exceptionally deep negative prices.
- France: relatively inflexible generation mix
In France, producer incentives also influenced the market outcome. The French support framework distinguishes between installations exposed to market incentives and plants operating under historical purchase obligation contracts. Under some legacy arrangements, producers have traditionally been protected from wholesale price movements, while the obligated buyer sells their electricity into the market This can reduce the motivation to cut production when spot prices fall sharply.
Recent reforms are seeking to increase the responsiveness of supported renewable generation by introducing curtailment requirements or suspending remuneration during negative price periods. However, the existing generation fleet still includes installations operating under earlier arrangements.
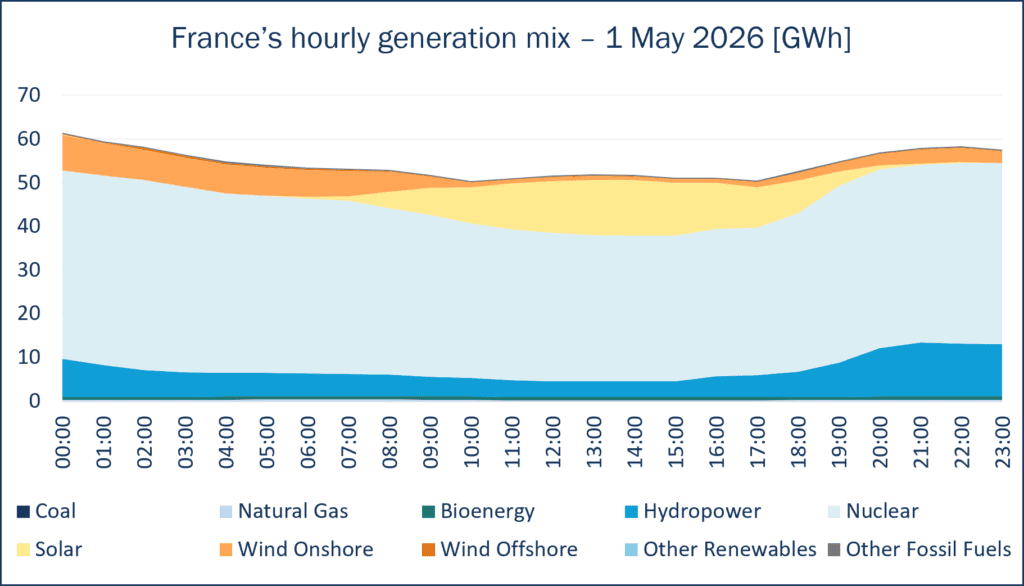
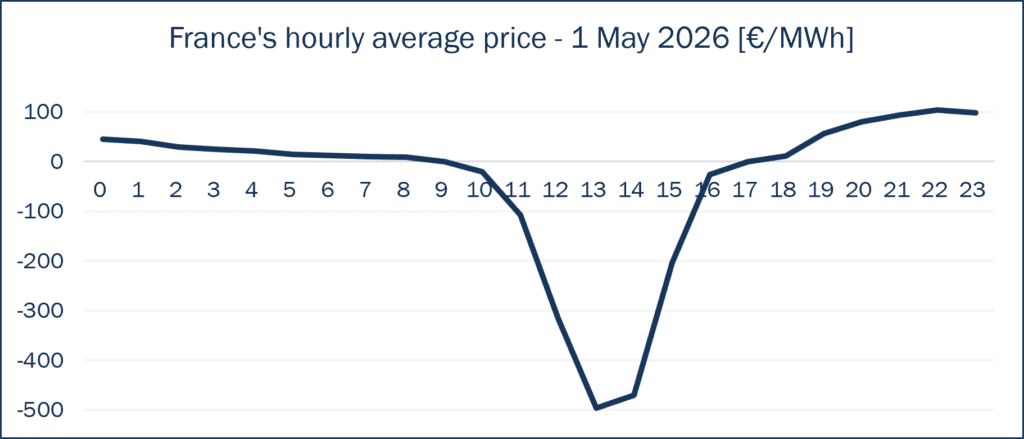
The charts for 1 May illustrate how these characteristics affected the French market. France entered the day with high nuclear availability, increasing solar production and particularly weak demand. The generation mix chart shows that nuclear output was reduced by approximately 10 GWh during the central hours. Nevertheless, the adjustment was insufficient to offset the combined production profile when demand was particularly weak.
The contrast with Spain was particularly visible in the solar profile. French photovoltaic generation remained much closer to its expected physical production curve, reaching its maximum during the central hours despite the sharp fall in prices. Nuclear generation did respond, but not sufficiently to prevent an exceptional market outcome.
The daily average price fell to -41.39€/MWh, while the minimum quarter-hourly price approached -500€/MWh.
- Germany: high renewable penetration and extensive support schemes
Germany combines one of Europe’s largest wind and solar fleets with a highly decentralised generation structure. Rooftop photovoltaic installations are particularly relevant, and many small units respond less directly to wholesale market prices than large assets managed by professional market participants.
Historically, the EEG framework supported a large proportion of renewable generation through feed-in tariffs and market premiums. Although larger plants increasingly market their electricity directly and assume greater balancing responsibility, support arrangements can still reduce their exposure to the spot price. Recent reforms are strengthening remote controllability and limiting remuneration for new installations during periods of negative prices, but the legacy fleet remains significant.
Germany’s extensive interconnection capacity normally provides an important outlet for surplus electricity. However, this benefit is reduced when neighbouring countries experience similar wind, solar and demand conditions. Internal network congestion can also prevent electricity from moving freely from areas of abundant generation to consumption centres.
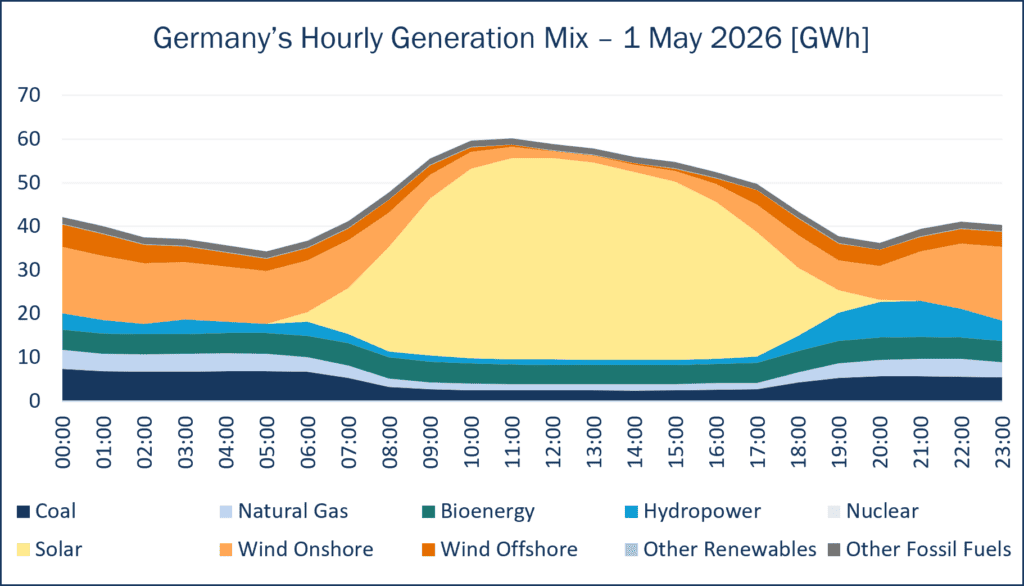
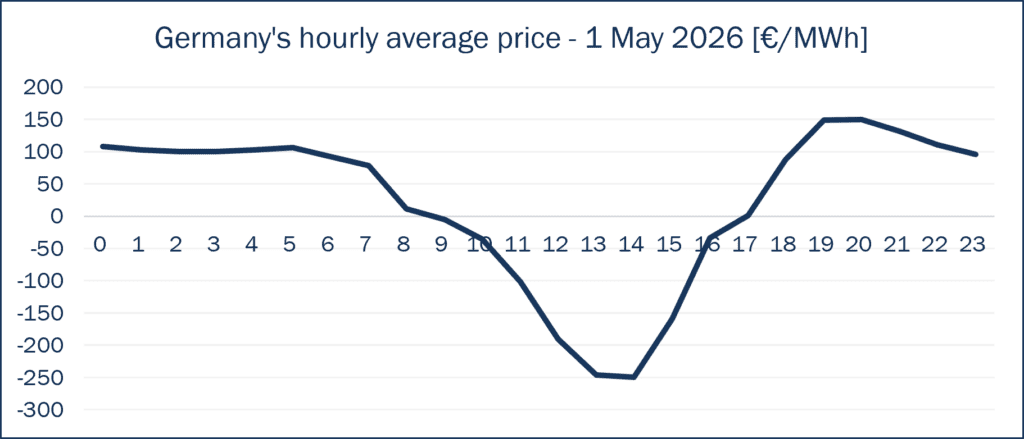
The charts for 1 May illustrate that German photovoltaic output remained close to its expected physical production profile, reaching high levels during the central hours without the reduction observed in Spain. At the same time, low demand and similar conditions in neighbouring markets limited the system’s ability to absorb or export the surplus generation.
As shown in the price chart, prices fell sharply during the central hours, although the daily average remained positive at €21.00/MWh. The minimum quarter-hourly price reached approximately –€250/MWh, illustrating that extensive interconnection alone cannot prevent deep negative prices when neighbouring markets are also oversupplied and part of the generation fleet responds only weakly to the wholesale price signal.
- What the comparison reveals
| 1 May 2026 | Spain | France | Germany |
| Daily average price | 57.87€/MWh | –41.39€/MWh | 21.00€/MWh |
| Minimum quarter-hourly price | c.0€/MWh | c.–500€/MWh | c.–250€/MWh |
| Visible solar modulation | Relatively strong | Limited | Limited |
| Main differentiating factors | Merchant exposure; limited interconnection | Nuclear-heavy mix; legacy support arrangements | Decentralised generation; EEG legacy; grid constraints |
The comparison demonstrates that renewable penetration alone does not determine the severity of negative prices. Spain, France and Germany experienced similar broad conditions, but their generation fleets and producer incentives reacted differently. Spain’s greater market exposure encouraged more visible photovoltaic modulation and limited the depth of the price trough. In France, nuclear generation reduced output, but not enough to compensate for strong solar production and weak demand. In Germany, decentralised generation, legacy support mechanisms and network constraints contributed to a less responsive production profile.
Negative prices therefore reveal more than a temporary electricity surplus. They show how effectively each market converts a price signal into an operational response.
5. Negative prices reveal the value of flexibility
Negative prices are increasingly becoming a valuation signal for flexibility rather than simply an indication of market imbalance. They create opportunities for batteries, demand response, aggregation and flexible generation to absorb electricity when it is abundant and release or reduce consumption when prices recover.
At the same time, they expose renewable producers and electricity buyers to greater profile risk. For generators, a high annual average market price does not necessarily translate into strong revenues if production is concentrated during low or negative price hours. Capture prices, curtailment exposure and contractual incentives therefore become increasingly important. For buyers, particularly those entering into PPAs, hourly generation profiles and shape risk matter as much as the agreed reference price.
As intraday price spreads widen, flexibility will become a central source of value. Market participants must therefore look beyond average prices and assess when electricity is produced, consumed and monetised.
Pablo Gandullo Romero