In our previous article, we explored different hourly price curve scenarios and how structural drivers — gas, CO₂, renewable penetration, and demand evolution — shape divergent trajectories in the European power market. However, even when holding these assumptions as a constant, the outcome can vary materially depending on how the hourly curve is parametrized. In other words, it is not only the “what” of the scenario that matters, but the “how” behind the construction of the hourly price distribution. In this article, we focus on this less visible yet decisive layer: how seemingly small modelling choices in curve parametrization can translate directly into tangible impacts on P&L, budget forecasts, and asset valuation.
Same Scenario, Different Curve, Different Economic Outcome.
The first key message is straightforward but often underestimated: two hourly curves built under the same macro scenario can generate different economic results.
Let’s assume an identical fundamental framework:
- Same fuel and CO₂ price assumptions
- Same installed renewable capacity
- Same demand growth and temperature normalisation
- Same annual baseload price (e.g. 90€/MWh)
Under these aligned assumptions, differences in parametrization can reshape the intraday structure of prices. An annual average price alone does not define profitability; additionally, including the distribution of prices across hours does.
To illustrate it, let’s compare two hourly curves constructed under the same scenario below. Both curves deliver identical annual average prices and a similar seasonal profile. However, they differ in their intraday peak spread, mid-day price suppression, and frequency of extreme price hours.
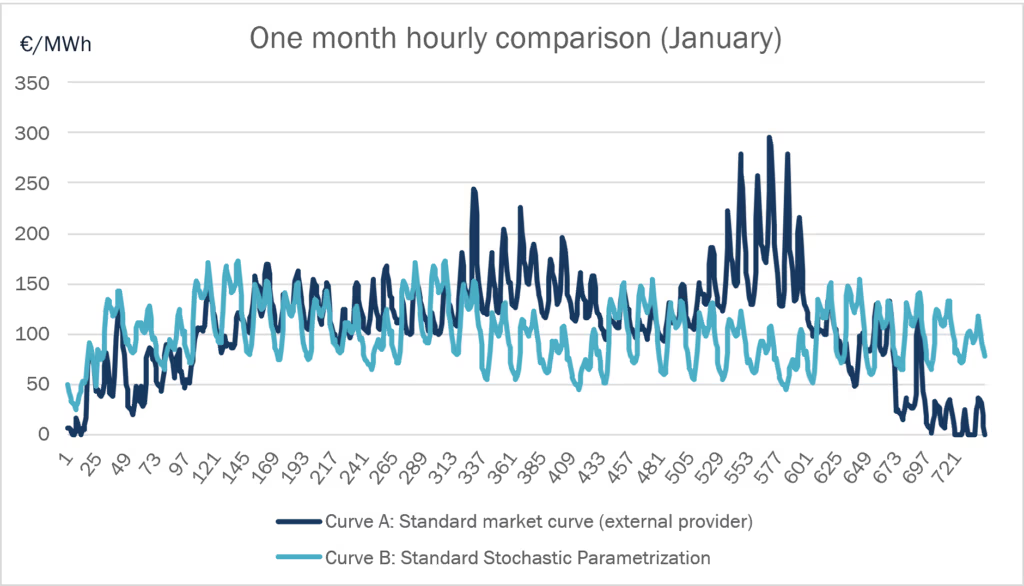
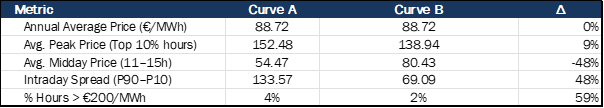
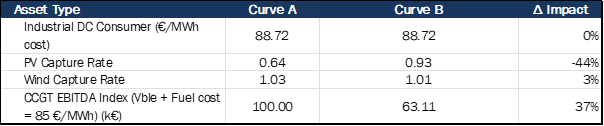
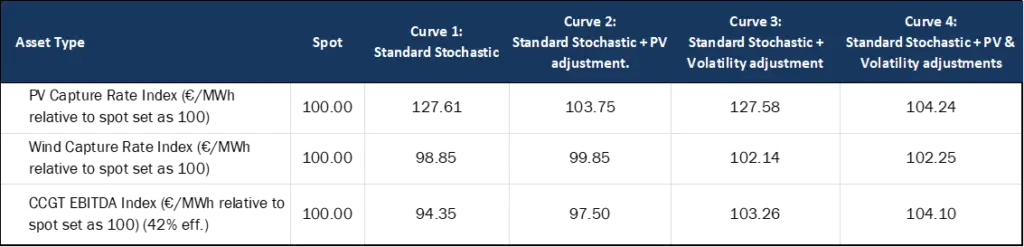
Table 2. Economic impact evaluation of curves. (Wind and PV are represented relative to baseload price and CCGT relative to the curve’s A result weighted as a hundred).
The graphic and table above are used to show how 2 curves with the same baseload calendar year price can show completely different behaviours and how this has a direct impact on the margins of different types of portfolios. Let’s look at the different relevant things we can infer from these tables:
- Spread, volatility and extreme events: Curve A in the first table shows greater volatility with more significant extreme ups and downs, while the second curve is flatter and lacks extreme spikes. This difference translates to a substantial impact on the margins for peaker plants like CCGTs, which rely heavily on the marginal clean spark spread.
- Mid-day prices and PV impact: Conversely, PV plants show a higher captured rate due to increased mid-day prices compared to baseload prices, which may lead to an overvaluation of these assets because of the historical undervaluation of PV development.
What does parametrization actually mean?
In the context of hourly price curves, “parametrization” refers to the set of modelling assumptions that dictate how prices are distributed across different hours once the macro scenario is established. Even if factors like fuel prices, CO₂ prices, renewable energy build-out, and demand growth are fixed, the hourly price curve is not uniquely determined. It relies on how the modeler translates structural drivers into hourly price behaviour.
There are two main modelling philosophies that dominate the construction of hourly curves: stochastic approaches and fundamental approaches. In practice, most commercial curves are a combination of both methods.
Fundamental Parametrization
In a fundamental approach, the hourly price curve is created based on the economic and physical principles of the power system, rather than relying on historical price trends. Prices are determined by the interplay between demand, renewable energy generation, the marginal costs of the thermal power fleet, interconnections, and scarcity conditions. This approach typically overlooks available forward prices, which reflect market participants’ expectations, industrial hedges, and speculative long/short positions.
Instead of directly modelling prices, the model simulates the process by which prices are formed. This requires, at least:
- Installed capacity by technology and retirement schedules
- Marginal costs (fuel, CO₂, efficiency assumptions)
- Hourly renewable generation profiles
- Demand projections and temperature sensitivities
- Cross-border flows and grid constraints
- Weather scenarios
- Policy and regulatory assumptions
In practice, this implies handling very large datasets (multi-year hourly demand, renewable production, temperature series, commodity prices, cross-border capacities, demand) and performing simulations across thousands of hours and multiple scenarios. For long-term horizons, this often means simulating tens or hundreds of thousands of hourly states. As a result, fundamental models are data-intensive and computationally demanding.
The strength of this modelling approach lies in its economic coherence: price formation is linked to marginal cost logic and residual demand dynamics. It allows explicit modelling of structural transformations — such as accelerated PV deployment, electrification, or coal phase-out — and facilitates consistent scenario construction. It also enables parameter transparency: one can identify how changes in PV penetration, scarcity pricing, or fuel costs alter the hourly structure of prices and, consequently, asset economics.
However, this sophistication does not eliminate uncertainty. On the contrary, it relocates it to the assumptions. Results are highly sensitive to parametrization choices such as:
- The level of PV cannibalization
- Demand elasticity under high-price regimes
- Scarcity price caps and frequency
- Volatility overlays
- Weather-year selection and weighting
In summary, while fundamental models provide structural consistency and forward-looking insights, their outcomes remain highly sensitive to the assumptions and parameters used in their construction. Small variations in key inputs can materially affect spreads, capture rates, and the resulting hourly price structure. In addition, the complexity and data intensity of these models can create a perception of precision that ultimately depends on the robustness of the underlying assumptions and forecasts. As such, modelling sophistication does not remove uncertainty; it simply shifts it to the definition, calibration, and governance of those parameters.
Stochastic (Statistical) Parametrization
A stochastic approach relies primarily on historical price data to generate forward hourly structures. It typically involves:
- Historical hourly price series
- Statistical bucketing (season/month, type of day, hour of day)
- Outlier removal and data smoothing
- Weighting methodologies across reference years
- Optional regression against external variables (e.g., residual demand, PV production, etc.)
The core assumption is structural persistence: that past relationships between demand, production and prices, remain broadly valid in the future.
The advantage is robustness and calibration to observed behaviour, but its main limitations are:
- Structural inertia can lead to historical patterns understating future cannibalization and volatility effects during rapid transformations like increased PV penetration. Conversely, historical analysis might not predict a saturation in PV installations after high investment, potentially affecting price cannibalization.
- Extreme events (outliers) such as commodity shocks or crises can distort statistical distributions, and while these events are often categorized as outliers, their exclusion may underestimate tail risk, and their full inclusion might overstate long-term price levels. The challenge is to assign coherent probability weights to such events rather than dismissing them as anomalies or assuming they signal permanent shifts.
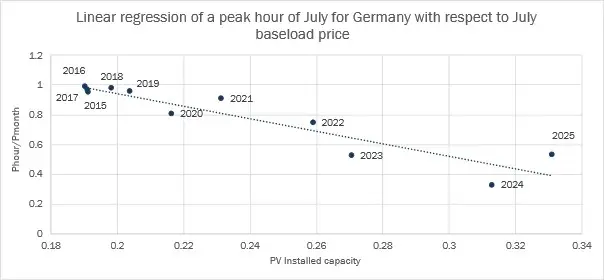
To represent these 2 limitations, see below 3 graphics related to structural inertia:
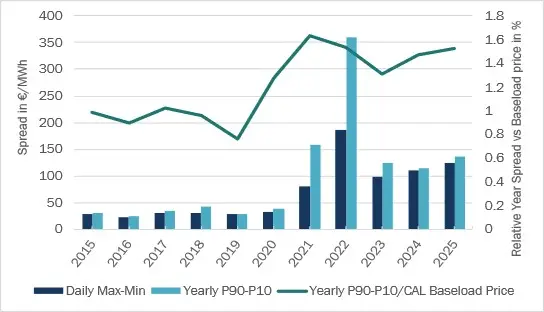
The first graph shows the correlation between the y-o-y evolution of the intra-day shape of the electricity curve and the installed PV capacity, related to the second point above. The 2nd and 3rd graphs show the monotonicity of hourly electricity prices for different years and different metrics to show daily and yearly price spreads, respectively.
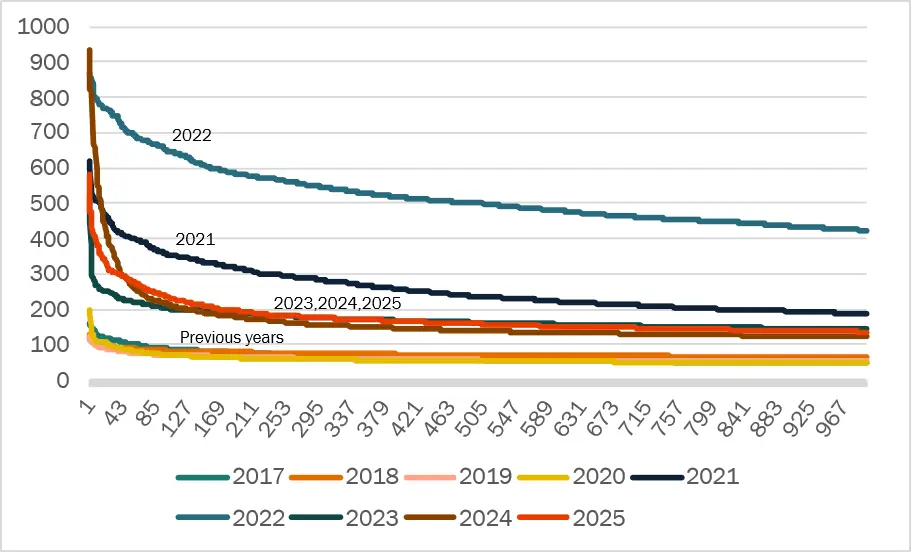
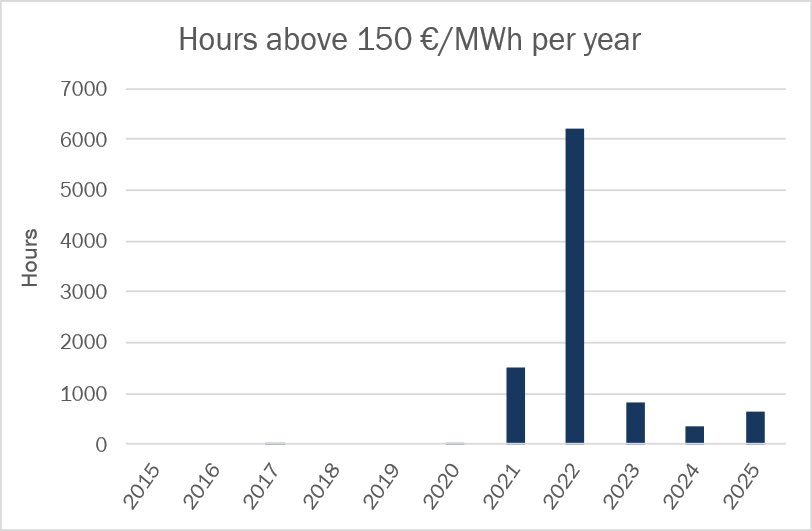
The years 2021 and 2022 stand out as significant turning points in market-structure volatility. In particular, 2022 can be regarded as an outlier year, with approximately 6,000 hours recorded above 150 €/MWh, primarily due to the unusual geopolitical challenges faced during that period.
HES Approach to curve modelling and parametrization
HES employs a methodology that begins with a stochastic curve constructed from historical prices and their hourly patterns within a given month. This approach also considers outliers based on the relationship between prices and non-residual demand historical profiles. HES utilizes available market forwards and price scenarios to establish price levels for the year, quarter, or month; this can also include weekly and daily futures.
Currently, this methodology produces an acceptable and compliant electricity curve that reflects rational behavior each month, aligning with historical curve shapes and the levels of forward baseload and peak load prices. However, due to the limitations mentioned, this approach may inaccurately weigh certain factors and their future developments, which could lead to the misvaluation of energy assets, whether related to consumption or generation portfolios.
To address these limitations and the potential misvaluation of assets in the energy sector, HES continuously enhances its electricity curve. Depending on the country and its fundamentals, our curve now incorporates additional factors to readjust undervalued metrics in the historical prices used as inputs for the stochastic model. These factors include: (i) PV cannibalization at current levels and (ii) price volatility, among others.
Analytical Assessment of Alternative Curve Parametrizations
In the table below, we analyse different metrics to assess how well the stochastic modelling plus ad.hoc modelling adjustments replicate spot behaviour, the example is run for Germany for electricity prices from 2023 to 2025.
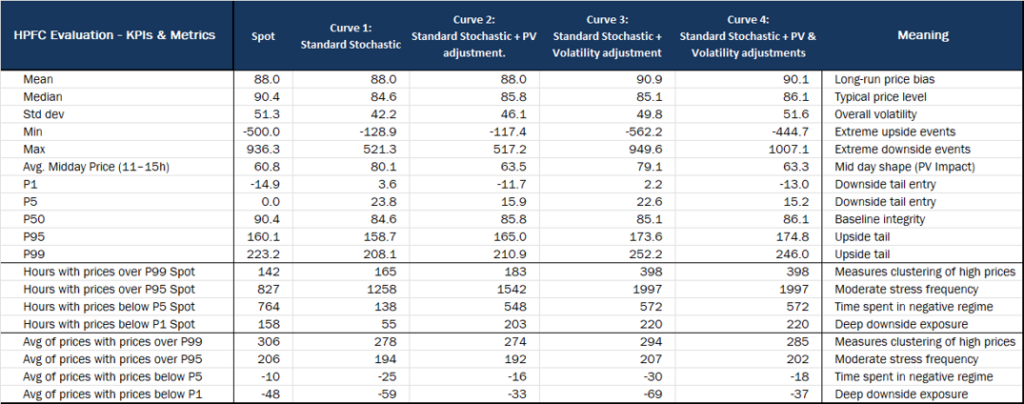
Even though just like for investing, past distributions do not assure future distributions, some conclusions can be drawn from the analysis developed above on different curves against spot:
- Stochastic modelling based on historical prices tends to over price solar hours as PV impact is softened, this can and is well adjusted when implementing a PV impact ad. Hoc modelling.
- Volatility and extreme price spikes from the stochastic modelling based only on historical prices tend to be weaker than the current market reality, due to the necessary outliers consideration made on input data. This is assessed through an ad.hoc volatility modelling that is able to adjust volatility to spot reality, though it is important to consider that 2023-2025 scenario is not necessarily future market reality and volatility will differ.
- Extreme upside and downside price events, geography and clustering need to be assessed and not overcompensated when applying volatility ad. Hoc modelling.
The most challenging aspect when modelling these curves is not replicating historical behaviour — which can usually be achieved to a reasonable extent — but determining how to project it into the future. This can and is usually done either by parametrizing the expected evolution of a fundamental driver with a strong relationship to the metric (e.g. PV capacity/production and its impact on mid-day prices) or by using recent historical years as a reference for future market behaviour, considering the most recent years generally provide the most relevant benchmark for the up-front periods.
Portfolio-Level Economic Impact of Alternative Curve Parametrizations
In this section, we adopt a more pragmatic perspective by evaluating the economic impact that the previously shown curve modelling approaches and parametrization adjustments can have on different types of generation portfolios (with analogous effects for consumption portfolios)
The example was run using German electricity, gas, and CO2 prices from 2023 to 2025. As mentioned before, even though past distributions do not guarantee future distributions, some conclusions can be drawn from this analysis:
- As observed before, this economic assessment confirms that the standard stochastic approach prices solar hours too high; applying a PV cannibalization adjustment is key not to overvalue PV and peak prices.
- Wind shows a more random behaviour closer to the baseload profile so hourly price distribution that we are modelling is less important than the monthly and yearly averages.
- Valuation of peakers such as CCGTs and other gas plants depends deeply on price spikes and volatility. Not modelling this assertively can turn into subvaluation or overvaluation of these assets and which can turn into big budgeting or investment decision mistakes.
Conclusion
In the February and March editions of this newsletter, we at HES have focused on illustrating how hourly electricity price curves are formed in the market and which key drivers shape them. From there, we explored the importance for companies within — or exposed to — the energy sector of having reliable forecasts of hourly electricity prices. Finally, we reviewed some of the standard modelling approaches used in the sector and demonstrated how even small differences in modelling assumptions can translate into very tangible impacts on a company’s P&L.
Through this discussion, we hope to have conveyed the importance of carefully assessing and challenging hourly price curve forecasts rather than treating them as static inputs. As power markets become increasingly complex, the robustness of these forecasts becomes a critical element of budgeting, valuation, and strategic decision-making.
At HES, we support our clients in this process through our in-house HPFC (Hourly Price Forecast Curve) model, which we continuously develop and refine to reflect evolving market fundamentals and modelling best practices. Whether it is constructing proprietary curves, reviewing third-party assumptions, or assessing the economic impact of different parametrizations, our objective is to help ensure that the curves underpinning your decisions accurately reflect the realities of the market.
Guillermo Llanos Macías