Spanish Market Analysis
Analysis of the Spanish energy market is key to understanding the dynamics and trends affecting the sector both locally and internationally. In this detailed analysis, we address the important factors influencing energy prices, supply and demand, and the latest regulatory policies. This comprehensive overview will allow you to keep up to date with weekly changes and anticipate possible market variations, both in Spain and in other relevant markets such as France.
June 2026
Table of Contents
Key figures of the month
Source: Haya Energy Solutions
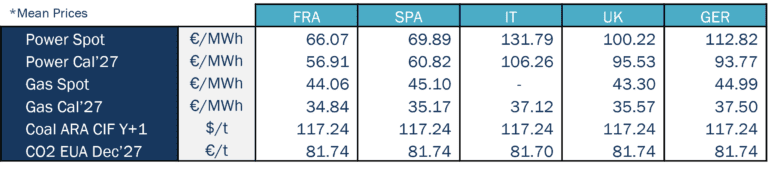
In June 2026, electricity spot prices increased across most major European markets compared with the previous month. In the forward market, Power Cal’27 remained broadly stable overall, with moderate increases in most countries and average changes of around 1 €/MWh. Overall, forward price levels shifted slightly upwards compared with those observed in May.
France and Spain remained in the lower range of monthly average electricity prices, between 65 and 70 €/MWh. France was the lowest-priced power market in the region, with an average price of 66.07 €/MWh, despite an increase of around 14 €/MWh compared with May. Spain ranked second, with an average price of 69.89 €/MWh, also up significantly, by around 20 €/MWh compared with the previous month.
By contrast, the UK, Germany and Italy all recorded average monthly prices above 100 €/MWh. Germany averaged close to 113 €/MWh, the UK remained around 100 €/MWh, and Italy stayed above 131 €/MWh. Particularly noteworthy was the increase in Germany’s monthly average price, which rose by around 20 €/MWh compared with May. Italy also recorded an increase of around 10 €/MWh, while the UK remained broadly stable relative to the previous month.
Overall, June once again highlighted the wide divergence in spot prices across Europe, with Spain and France in a 65–70 €/MWh range, while countries such as Germany and Italy remained at much higher levels, in some cases close to or above double that range.
June was also a record month for solar PV output across several major European markets. New all-time daily highs for June were reached in Germany (489 GWh), France (183 GWh) and Italy (161 GWh). In the case of Spain, the record was even more significant, as the 267 GWh reached on 26 June was not only the highest solar output ever recorded for a day in June, but also the country’s all-time daily solar generation record.
On the gas side, average spot prices remained broadly stable around the 43–45 €/MWh range across most markets. Compared with May, gas prices declined modestly across all countries. Gas Cal’27 also moved lower on a month-on-month basis across all countries.
As has been the case since the outbreak of the conflict, gas price formation remained largely driven by developments involving Iran, Israel and the United States, and, in particular, by events affecting the transit of gas and oil through the Strait of Hormuz. A more detailed review of the main developments during June and their impact on gas prices is provided in section 3.
As for CO₂, prices increased from around 79 €/t in May to 81 €/t in June, extending the upward trend observed in the previous month. June was therefore bullish on average for the carbon market, although the ceasefire agreement triggered a partial correction towards month-end.
Energy demand and generation mix
Source: Haya Energy Solutions
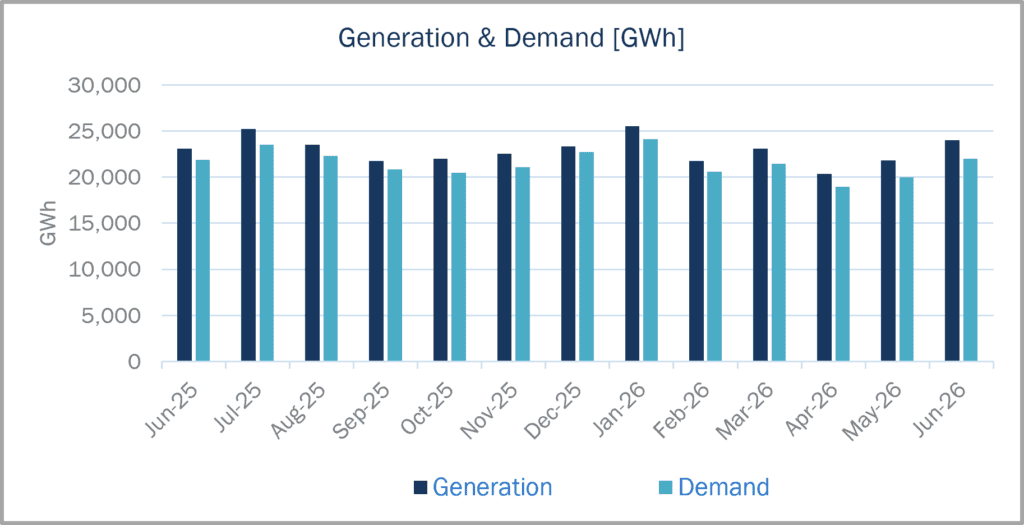
Spanish electricity demand reached 21,962 GWh in June 2026, while total generation stood at 23,997 GWh. Of this volume, around 2,035 GWh was scheduled for export.
Compared with May 2026, both electricity demand and generation increased. On a year-on-year basis, demand and generation were also higher than the levels recorded in June 2025.
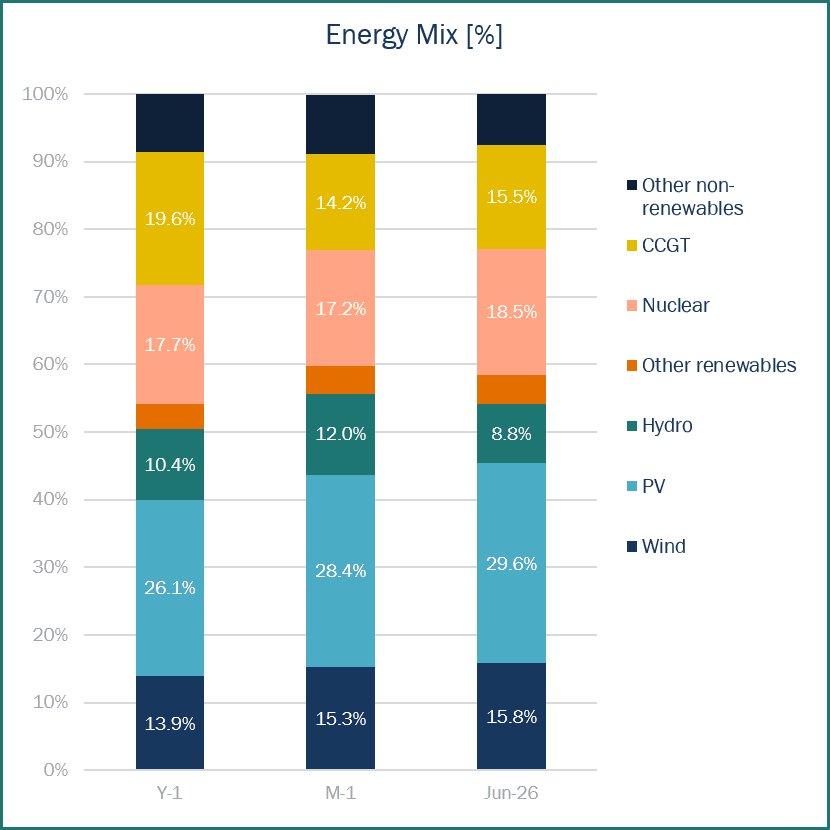
Renewables represented 58.5% of Spain’s generation mix in June 2026, down from 59.9% in May 2026, but above the 54.2% recorded in June 2025. Solar PV remained the leading generation source, accounting for 29.6% of total output. This was above both May 2026 (28.4%) and June 2025 (26.1%).
Nuclear retained its position as the second-largest generation source, reaching 18.5% of total output, above the 17.2% recorded in the previous month. The main developments for this technology during June were the unplanned outage at the main turbine of Vandellós II on 5 June, with plant safety systems operating correctly, and the completion of the 31st refuelling outage at Ascó I on 12 June, marking the start of its 32nd operating cycle.
Wind ranked third, contributing 15.8% of total generation, above both May 2026 (15.3%) and June 2025 (13.9%).
Overall, one of the most notable features of the month was the continued dominance of solar PV in Spain’s generation mix. Its contribution remained well above that of nuclear and close to double that of wind, confirming the particularly strong role played by solar generation during the month.
Source: Haya Energy Solutions
More broadly, the generation structure in June 2026 remained very similar to that observed in May 2026. While some marginal changes were recorded, there were no major shifts in the contribution of the main technologies or in their ranking within the generation mix. A similar picture emerges when compared with June 2025, although in this case the stronger role of solar PV and the lower relative weight of CCGTs are more clearly visible.
Energy prices & market panorama
Source: Haya Energy Solutions
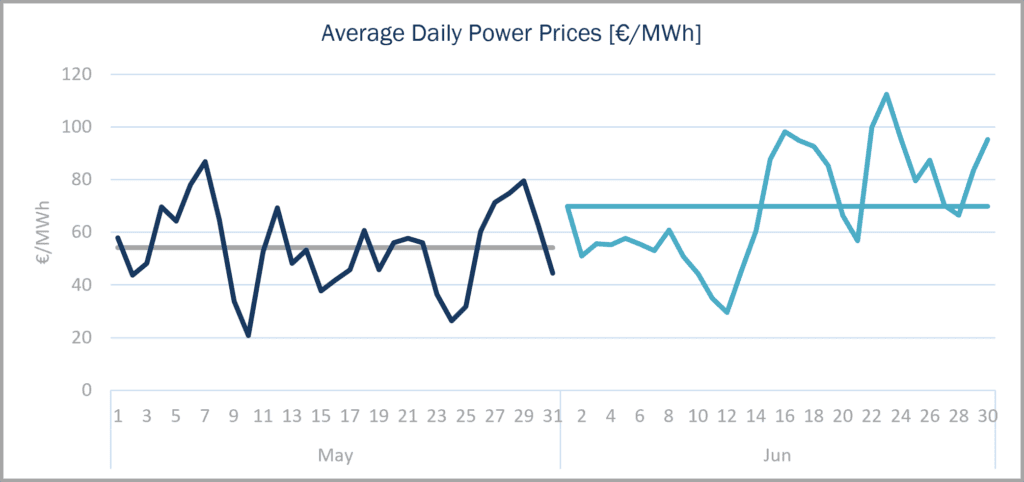
Spain’s average wholesale electricity price stood at 69.89 €/MWh in June 2026, above the 54.23 €/MWh recorded in May. This marked the second consecutive monthly increase in the average power price. At the same time, the intraday pricing pattern observed in previous months remained clearly in place: electricity prices tended to fall to near-zero, or even negative levels, during hours of strong solar generation, before rising sharply once solar output faded.
Looking at the daily average price profile, the first half of the month was characterised by daily prices that remained clearly below the monthly average. By contrast, the second half of June showed much greater variability, with sharp swings in daily average prices over short periods of time. In absolute terms, the daily average price fell to around 29 €/MWh on 12 June, while the monthly peak was reached on 23 June, when it exceeded 112 €/MWh. A second pronounced peak was also recorded on 16 June, when daily average prices approached 100 €/MWh.
As in previous months, price formation remained heavily shaped by the high level of renewable penetration in Spain, particularly solar PV, which continued to exert strong downward pressure on prices during the central hours of the day. Those days when stronger demand or weaker solar output prevented prices from falling close to 0 €/MWh during solar hours were also the days that later recorded daily average prices close to, or above, 100 €/MWh. This highlights the extent to which the Spanish power market continues to depend on solar generation to contain wholesale electricity prices.
As a result, Spain remained one of the most competitive power markets in Europe in terms of average monthly prices, largely thanks to the strong contribution of solar PV, which pushed prices sharply lower during certain hours of the day. Without this effect, prices would be more frequently set by gas-fired technologies, leading to significantly higher wholesale levels, as is typically the case in markets such as Italy, where monthly average electricity prices often remain above 100 €/MWh.
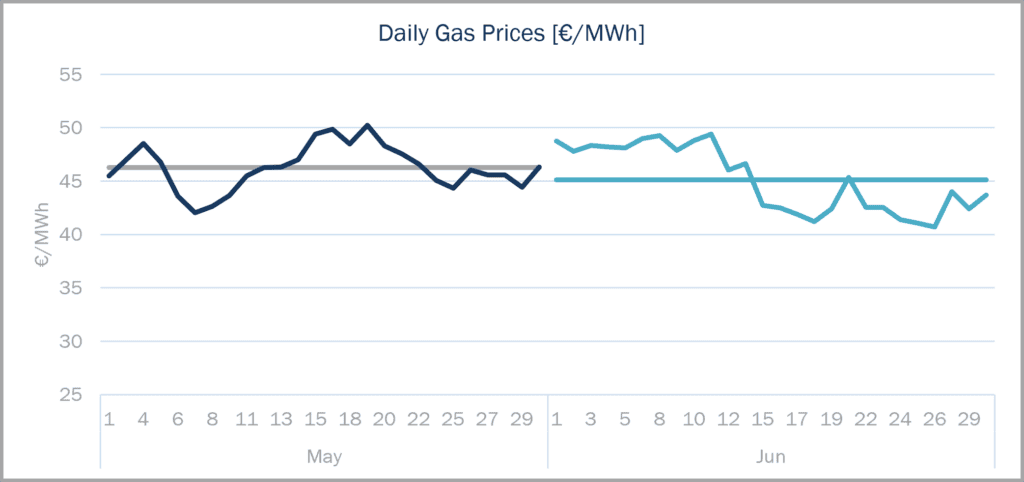
The average natural gas price in the Spanish market stood at 45.10 €/MWh in June 2026, down from 46.25 €/MWh in May. Price evolution during the month was initially relatively stable, with levels remaining close to 50 €/MWh until 11 June. From that point onwards, gas prices moved into a clearer downward trend, albeit with some temporary rebounds, and fell to levels close to 40 €/MWh by the end of the month. Overall, this represented a decline of around 20% in just three weeks.
Source: Haya Energy Solutions
This pronounced downward move was mainly triggered by geopolitical developments. On 11th June, Donald Trump announced that previously planned attacks had been cancelled, arguing that talks had reached the “highest level” within Iran and that a possible understanding was under way, despite Iranian denials. This opened the door to further diplomatic progress, including the 17th June memorandum of understanding, which focused on a ceasefire, the reopening of the Strait of Hormuz, nuclear negotiations and partial sanctions relief. Although the diplomatic process advanced during the rest of the month, the negotiations remained fragile, with sporadic attacks still being reported.
In terms of monthly extremes, gas prices reached their high at 49.40 €/MWh on 11 June, while the low of 40.70 €/MWh was recorded on 26 June. Overall, gas price formation remained highly sensitive to geopolitical headlines, although volatility was lower than in previous months.
Market trends and futures
Source: Haya Energy Solutions
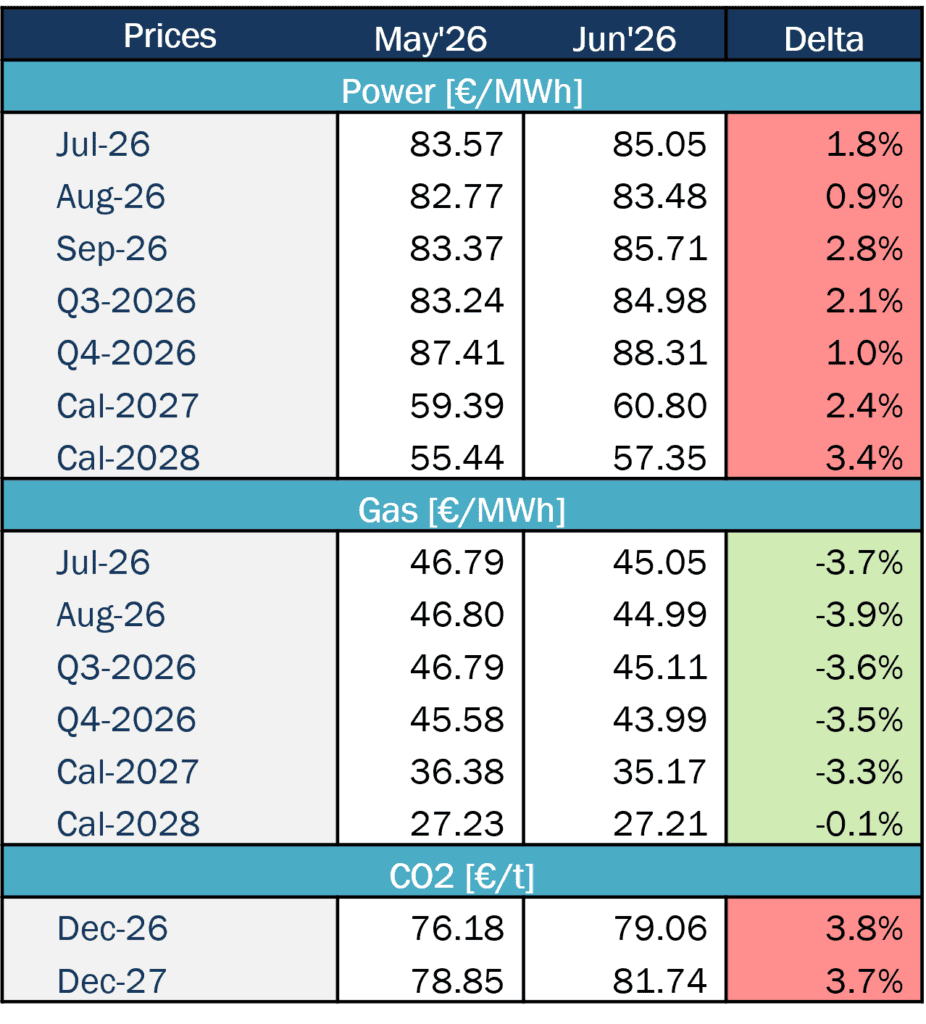
Spanish electricity forward prices moved higher across all products in June 2026 compared with the previous month, marking the second consecutive month of increases across the entire market. However, these increases were much more moderate than those recorded in May, ranging from around 0.9% in August forward price to 2.8% in the September product, well below the increases close to 10% seen in some cases during the previous month. Even so, the fact that this bullish repricing was visible across all power forward products confirms a continued generalised increase in wholesale electricity price expectations.
In the gas market, by contrast, month-on-month declines were observed across all the products under review. All contracts fell by more than 3% compared with the previous month, with the only exception of the longest-term product, Cal-2028, which remained broadly stable. This reflects the trend described in the previous section, namely the strong dependence of gas prices on developments in the conflict involving Iran and the United States, and how the progress made in peace negotiations during June contributed to a broad-based decline across gas products.
Regarding storage levels, natural gas reserves in the European Union currently stand at 48.62% of capacity, an increase of around 8 percentage points compared with the previous month. In cumulative terms, European gas storage levels have risen by around 16 percentage points over the last two months. Although inventories remain relatively low for this stage of the year, the recent trend is clearly positive. In Spain, gas reserves currently stand at 73.95%, around 4 percentage points above the previous month and still well above the EU average.
CO₂ prices moved higher during the month, extending the upward trend observed over the previous two months, although some downward pressure emerged towards the end of June as geopolitical tensions eased. The monthly increase was mainly driven by the energy risk premium linked to the Iran war, which supported European gas prices and raised expectations for coal-fired generation. In addition, the European heatwave lifted power demand and tightened system conditions, further underpinning carbon prices.