European power markets are undergoing a rapid transformation, which is evident in the evolution of hourly market curves. Price formation is no longer determined solely by seasonal demand cycles; it is increasingly influenced by renewable generation profiles, flexibility constraints, and short-term scarcity events. This shift has created a growing need for forecasts at various levels of granularity. While annual averages remain useful for strategic planning, hourly curves have become essential for trading, hedging, storage optimization, and asset valuation.
The increasing penetration of variable renewable energy sources, such as solar photovoltaic (PV) and wind, has altered the generation-demand equilibrium. Markets now experience more frequent episodes of oversupply during hours with high renewable output and scarcity during hours with low renewable generation. This results in stronger intraday price swings and a higher occurrence of negative or very low-price hours, especially in systems dominated by solar energy. Due to these changes, the spot market price is defined with a 15-minute granularity since October 2025.
At the same time, market coupling and cross-border flows are contributing to a partial convergence of price patterns. However, local constraints, such as grid congestion and flexibility shortages, still shape country-specific curves. Consequently, understanding and forecasting hourly curves has become a cornerstone of modern power market analysis.
An hourly curve forecast entails projecting market fundamentals generation, demand, residual load, and prices—for each hour of the day over a given horizon. This approach effectively captures the intraday structure of the market, which is increasingly vital as renewables dominate marginal pricing dynamics.
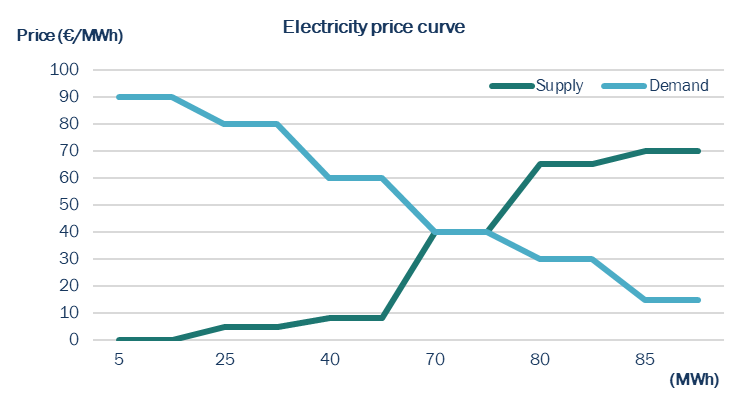
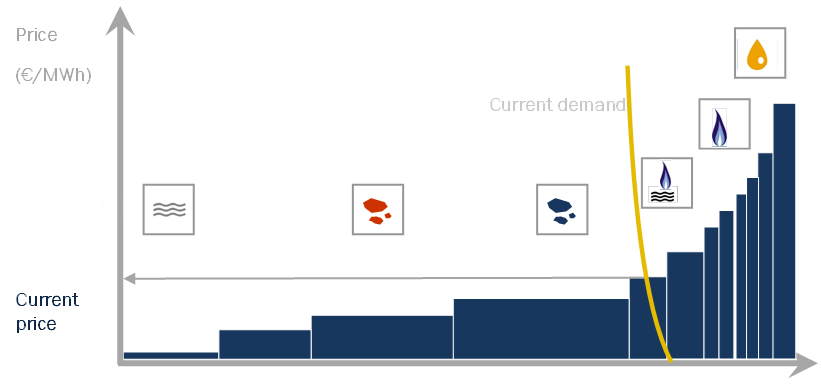
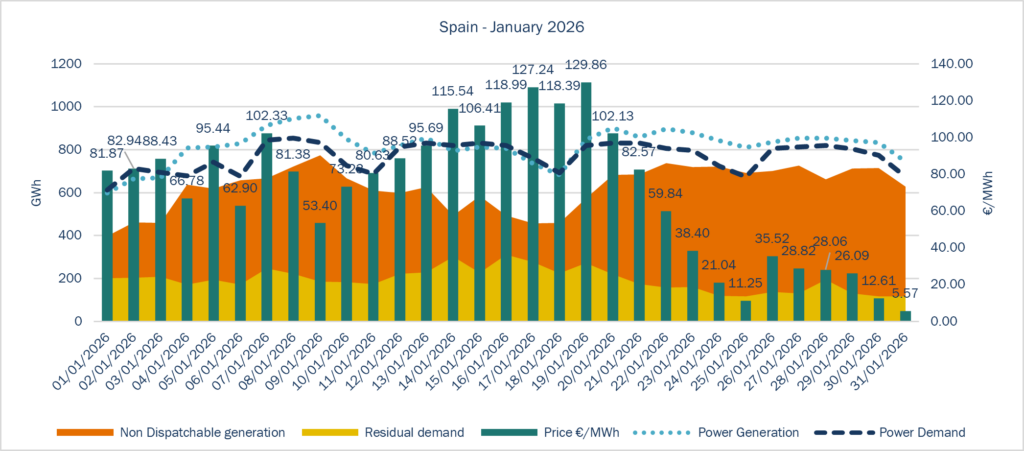
Analysts assess hourly curves of production and demand by identifying peak and base consumption periods, as well as peak periods of renewable generation from sources such as solar and wind. They also consider energy demand, including residual demand, which refers to the demand not met by renewable generation. Additionally, flexibility assessments are conducted to evaluate the ability of dispatchable generation, storage, and imports to balance the system. By comparing these curves, analysts can determine when the system is in a state of surplus or deficit and which technologies are likely to set the marginal price. In continuation of the previous example, the supply is now depicted in accordance with the available technologies within the mix. In this context, dispatchable sources play a crucial role in influencing pricing when residual demand exceeds supply, particularly when the demand is not met by non-dispatchable renewable energy sources.
Another important factor to consider is that different mix of generation technologies create distinct hourly signatures, often referred to as the “shape of the curve.”
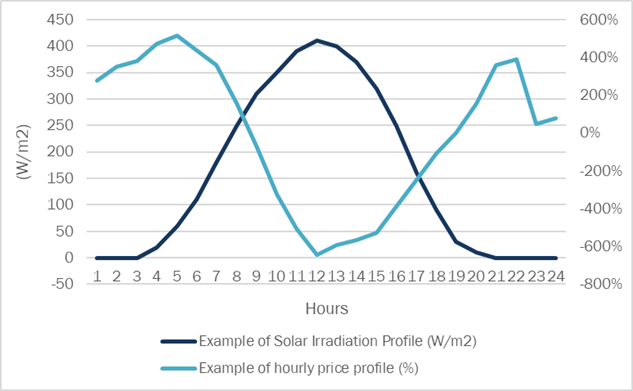
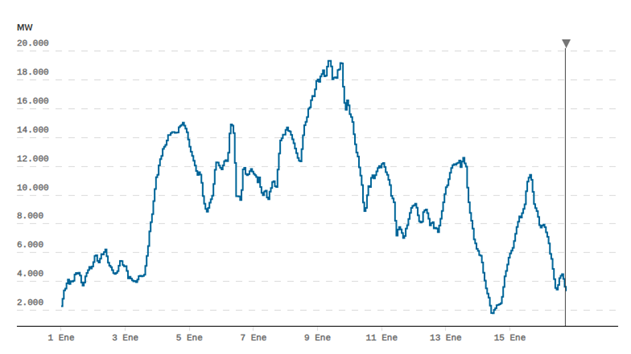
- Photovoltaic Generation (Duck Shape): In Spain, high penetration of photovoltaic (PV) systems leads to a significant generation peak around midday. This peak pushes prices down during solar hours and creates steep increases in prices during the evening when solar generation decreases but demand remains high. As a result, there is a pronounced “duck-shaped” residual demand curve.
- Wind Generation (Increased Volatility): Wind generation is more stochastic, meaning it varies unpredictably. For instance, in France, where there is considerable wind capacity, price fluctuations can be sharper across different hours and days, leading to increased uncertainty and volatility in pricing. Systems with high wind penetration require more backup and balancing services
- Battery Storage (Decreased Volatility): Batteries help reduce volatility by charging during low-price renewable surplus hours and discharging during peak demand hours. As the utilization of storage technology grows, price extremes can be partially smoothed out, reducing the frequency of negative prices and lowering peak prices in the evening.
- Nuclear (Stability in France): France’s nuclear fleet offers baseload stability, which dampens intraday price swings compared to Spain, where marginal pricing is more susceptible to variations in gas and solar generation.
Hourly electricity prices are fundamentally determined by the balance between hourly demand levels, available renewable output and the marginal dispatchable technology (gas, coal, imports).
During peak consumption moments, such as the morning and evening, demand typically rises while solar output may be low. This leads to increased reliance on gas-fired plants, resulting in higher prices. Conversely, during off-peak hours or periods of high renewable generation (like midday in Spain or windy nights in France), lower marginal costs from renewables can push prices downward, sometimes leading to negative prices when supply exceeds demand and flexibility is insufficient. This is seen in the Spanish power market quite often during the last years, due to the excess of renewable power generation during certain periods of time. Thus, the hourly price curve reflects the marginal technology stack:
A high share of renewable energy sources (RES) results in lower midday prices. However, they add volatility and price spikes; solar energy brings midday prices down, while wind energy increases volatility due to its unpredictability and also lowers night prices. The increased reliance on gas leads to higher prices.
The greater storage penetration contributes to a smoother price curve.
In addition, there is the residual demand and its impact on hourly price curves. The residual demand, defined as total demand minus non-dispatchable technologies generation (normally considered as the must-run technologies, including most renewable and nuclear as base load production), has become a key driver of price shape. Countries with significant solar penetration often experience pronounced midday troughs in residual demand, while wind-heavy markets display irregular residual load patterns. Residual demand explains several characteristics we observe in price curves, such as midday price depressions, evening scarcity spikes and higher intraday price spreads. This concept is central to our recent NWSL made regarding the evolution of power demand and generation, as it links renewable output directly to price formation.
Therefore, part of the key structural drivers of the fundamental aspects shaping hourly price curves are the composition of the generation mix, the renewable penetration and cannibalization effects the availability of flexibility (storage, hydro, demand response), cross-border interconnections, pass-through of fuel and CO₂ costs, market design (including price caps and balancing rules).
Together, these factors determine whether a market experiences smooth baseload pricing or high volatility characterized by frequent spikes and negative price hours.
Thus, to determine different forecasts, diverse considerations are taken to define each possible scenario:
- Short-term (ST, days to weeks): Used for spot trading, dispatch optimization, and balancing strategies.
- Medium-term (months to 1 year): Useful for hedge calibration, shaping the forward curve, and forecasting asset revenue
- Long-term (LT, multi-year): Essential for making investment decisions, pricing Power Purchase Agreements (PPAs), and modeling capacity expansion.
The development of these scenario approaches (short, medium, long) is crucial to account for uncertainties related to weather, outages, fuel prices, and changes in policy. These scenarios can be further detailed with different types of profile generation, for example. Furthermore, the impact on a company’s P&L initial budget can significantly impact financial performance. While budgets are typically based on yearly baseload assumptions, actual exposure relies on hourly capture prices. For instance:
- A solar asset may underperform its budget if midday prices decline due to market cannibalization.
- A flexible gas plant may exceed expectations if peak price spreads increase.
- Storage revenue is entirely dependent on intraday volatility and spread forecasts.
Therefore, accurate hourly forecasting is essential for minimizing budget variance, optimizing hedging strategies, and shielding the company’s profit and loss from unexpected market shifts.
At HES, we create our own price curve scenarios based on statistical measurements and analyses that reflect a shape consistent with current fundamentals. Each country has unique characteristics, requiring customized scenario development. Our considerations include intraday price spikes, renewable energy penetration, the impact of other commodities, and residual demand, all of which are essential for shaping scenarios for different time horizons.
Cheyenne Rueda Lagasse