Spanish Market Analysis
Analysis of the Spanish energy market is key to understanding the dynamics and trends affecting the sector both locally and internationally. In this detailed analysis, we address the important factors influencing energy prices, supply and demand, and the latest regulatory policies. This comprehensive overview will allow you to keep up to date with weekly changes and anticipate possible market variations, both in Spain and in other relevant markets such as France.
Table of Contents
July & August 2025
Key figures of the month
Main takeaways
- Spot prices experienced a notable decline across all markets from July to August, with Germany and France leading the way. Meanwhile, Italy and the UK are holding their ground as the most expensive forward markets, underscoring a persistent structural tightness.
- Key drivers like gas and CO₂ costs are playing a crucial role in stabilizing forward prices, while coal remains a steady yet elevated reference fuel. Interestingly, the energy mix for the summer months (July–August 2025) has been heavily influenced by solar PV, which accounted for about 25%, with a growing contribution from nuclear energy adding momentum.
- Despite some weakness in hydro energy, the increased output from nuclear and Combined Cycle Gas Turbines (CCGT) has kept the system stable. In comparison to the previous month, July saw a shift in the energy mix, moving away from hydro and CCGT towards more nuclear and wind power, with August providing more stability across all energy sources.
- The market is showing typical seasonal demand fluctuations, peaking during the winter and midsummer. Year-over-year, 2025 is projected to witness stronger demand and heightened generation, indicating not only rising consumption but also an adequate supply response.
- A temporary dip in energy production during April and May 2025 highlights the weather’s influence on market volatility, yet the overall trajectory suggests a resilient balance between supply and demand.
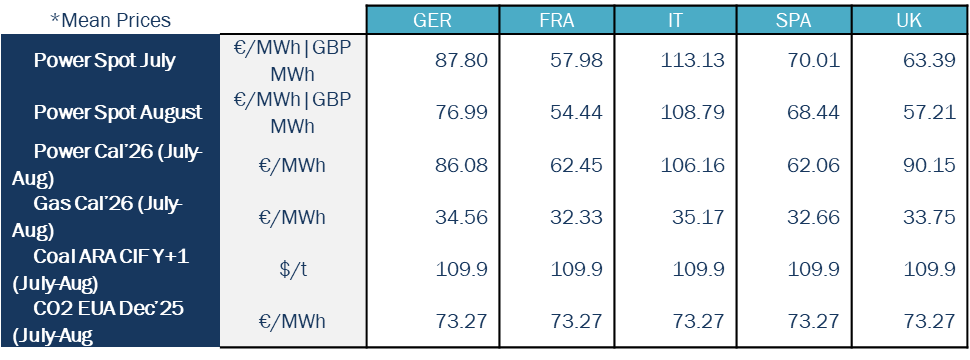
Germany (GER) and France (FRA) recorded the lowest average spot power prices, with Germany seeing a decrease from €87.80 in July to €76.99 in August, while France’s prices dropped from €57.98 to €54.44 during the same period. These declines reflect relatively well-supplied markets and weaker demand.
Italy (IT) remained the most expensive market, although prices dropped from €113.13 in July to €108.79 in August. This is consistent with its structural dependence on gas imports and higher demand for cooling.
Spain (SPA) experienced stable pricing, with a slight decrease from €70.01 to €68.44.
In the UK, prices softened more significantly, falling from £63.39 to £57.21, in line with decreasing continental benchmarks and improved renewable energy generation.
Power prices for Cal’26 were notably higher than current spot levels, particularly in the UK (€90.15/MWh) and Italy (€106.16/MWh). This indicates the presence of risk premiums associated with fuel markets and concerns over long-term supply security.
In contrast, Continental Europe exhibited a flatter forward curve, with prices of €86.08 in Germany, €62.45 in France, and €62.06 in Spain. This trend reflects a stable outlook for generation in these regions.
Gas for delivery in 2026 averaged between €32 and €35 per megawatt-hour (MWh), with Italy at the higher end, averaging €35.17. This indicates ongoing regional differences in pricing.
Coal prices (ARA CIF Y+1) remained stable at $109.90 per tonne across various markets, underscoring its position as a marginal fuel with limited price fluctuations.
EU Allowances (EUAs) for December 2025 remained strong at €73.27 per tonne, which continues to support forward power prices, despite recent declines in spot prices.
Energy demand and generation mix
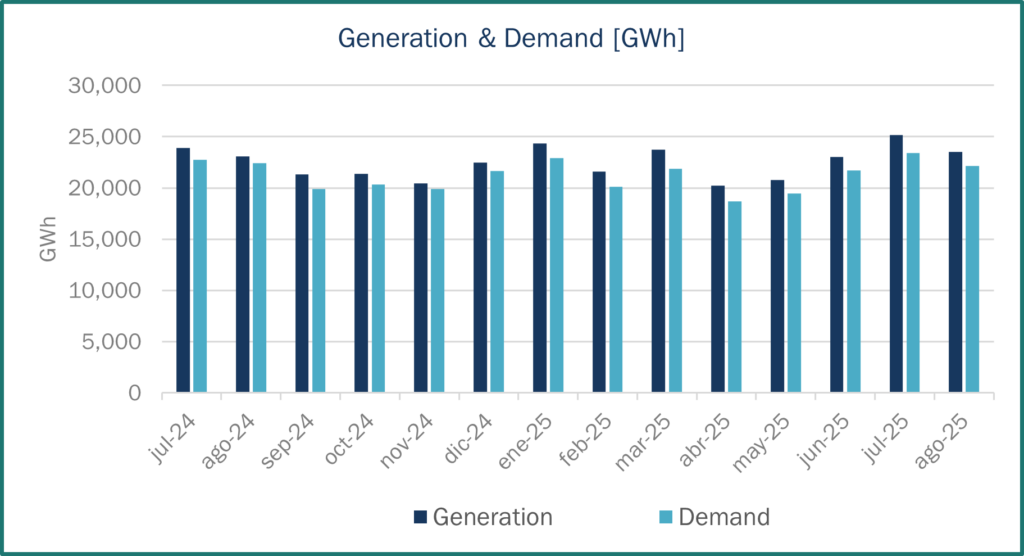
Generation and demand demonstrate notable seasonal fluctuations, characterized by peak levels during the colder winter months (January–March 2025) and the warmer summer months (July–August 2025).
The most pronounced month-on-month surge in generation occurred in January 2025, with an impressive increase of approximately 4 TWh compared to December 2024, largely fuelled by heightened winter energy demands.
In sharp contrast, the months of April and May 2025 experienced a significant downturn in both generation and demand, with total demand plummeting below 20 TWh and generation decreasing even more dramatically. This decline suggests the influence of unusually mild weather, leading to reduced energy consumption during this period.
However, by July and August 2025, both metrics rebounded robustly, with generation reaching an impressive peak close to 25 TWh, ultimately outstripping demand and indicating a healthy energy supply scenario.
A comparison of July and August 2025 against the same months in 2024 reveals a strikingly positive trend, with both generation and demand showing significant increases in 2025, reflecting a more resilient supply-demand equilibrium:
- Generation saw an uptick in July 2025 with an increase of around 1 TWh, followed by an additional increase of about 0.5 TWh in August 2025 compared to the previous year.
- Demand also rose, with July 2025 recording an increase of approximately 0.8 TWh and August 2025 showing an additional increase of about 0.6 TWh relative to the same months in 2024.
This indicates a market that, while tight, maintains a balanced dynamic, with generation consistently meeting or slightly exceeding the evolving demands of consumers.
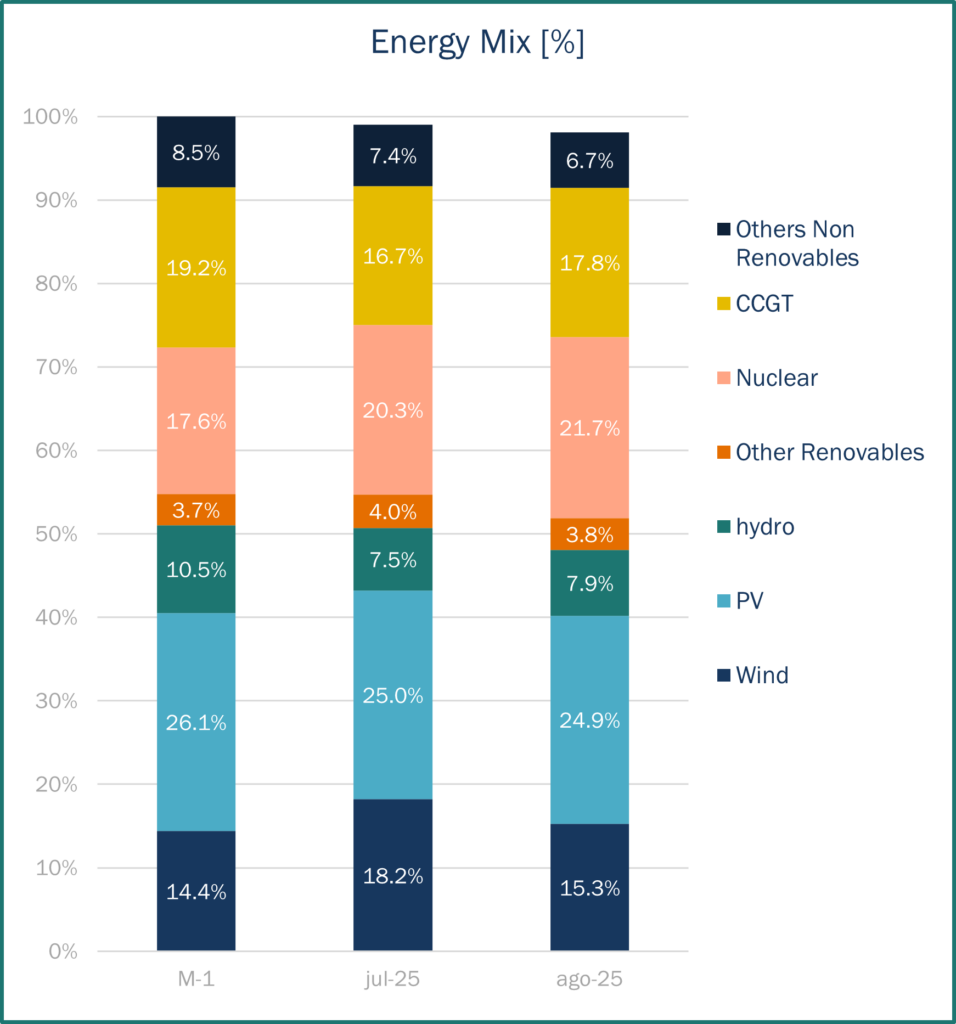
In July 2025, the contribution of wind energy surged to 18.2%, a notable increase from 14.4% in the previous month, although it experienced a slight correction in August 2025, settling at 15.3%. This fluctuation underscores the inherent seasonal variability of wind patterns.
Meanwhile, solar photovoltaic (PV) generation demonstrated remarkable stability, consistently hovering around 25% during the July-August period, affirming its vital role as a reliable summer baseload energy source.
Hydro energy saw a sharp decline from 10.5% in the prior month to just 7.5% in July 2025, before showing a modest recovery in August at 7.9%. This trend appears closely tied to changing hydrological conditions affecting water flow and reservoir levels.
Nuclear energy steadily gained momentum, with its share rising from 17.6% to 20.3% and finally reaching 21.7%. This upward trajectory highlights nuclear power’s essential role as a consistent backbone in the energy generation landscape.
The role of Combined Cycle Gas Turbines (CCGT) experienced a decline from 19.2% in the previous month to 16.7% in July 2025, with a slight rebound to 17.8% in August. This pattern illustrates CCGT’s flexibility and adaptability in balancing the intermittency of renewable sources. The contributions from other non-renewable sources and other renewables remained stable, oscillating around 7-8% and approximately 4%, respectively, indicating a steady presence in the energy mix.
Collectively, renewable energy sources—including wind, PV, hydro, and other renewables—consistently account for about 50% of the overall energy mix, with solar PV emerging as the most dependable contributor during the summer months.
The increasing share of nuclear energy emphasizes its growing significance as a stabilizing force in the energy grid, particularly in the face of the fluctuations associated with renewable energy sources.
CCGT continues to play a crucial role as the balancing technology within the energy ecosystem, efficiently modulating its output in response to the availability of renewable energy and fluctuations in demand.
Source: Haya Energy Solutions
Energy prices & market panorama
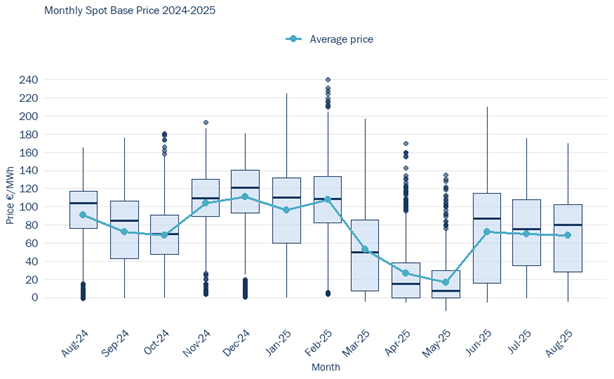
- Compared to Spring 2025, summer saw a clear recovery in average prices, moving back to the €70/MWh range.
- Volatility increased progressively from June to August, highlighting the impact of weather-driven demand and renewable variability.
- Despite this rebound, prices stayed well below winter highs (>€110/MWh), showing that the market remains adequately supplied, with no structural tightness during the summer months.
Source: Haya Energy Solutions
Summer 2025 (Jun–Aug)
As summer rolled in, prices began to recover incrementally in June 2025, averaging around €70/MWh. This uptrend stabilized through July and August, hovering between €70–75/MWh—well below the peaks experienced in winter, yet still above the lows of spring. While volatility returned to the market, it remained less severe than that of the winter months, primarily driven by fluctuations in demand and the intermittent availability of renewable energy sources.
The summer months, therefore, painted a picture of cautious optimism and recovery amidst the broader energy landscape:
June 2025
- The average price of electricity rebounded significantly to approximately €70/MWh, marking a sharp recovery from the spring’s low points.
- The pricing distribution widened once more, with instances where prices spiked beyond €120/MWh, underscoring the market’s responsiveness to sudden surges in demand, particularly driven by heat-induced cooling needs and the variability of renewable energy sources.
- This shift indicated a pivotal transformation from the stagnant spring market to a more dynamic and balanced summer season.
July 2025
- Electricity prices steadied within the range of €72–75/MWh, registering a modest increase compared to June yet remaining considerably lower than the extremes experienced during winter.
- The volatility in the market moderated, with the majority of trades consistently occurring between €50 and €100/MWh, revealing fewer dramatic outliers than were witnessed in the winter months.
- This trend suggests a more predictable and stable market environment, bolstered by robust solar output, effectively alleviating some of the demand pressures.
August 2025
- Average prices maintained a similar trajectory to July, hovering around €70–72/MWh.
- Nevertheless, analysis of the boxplot reveals a broader range of price fluctuations, with occasional outliers surpassing €120/MWh, signalling a resurgence in market volatility. This renewed instability is likely attributable to extreme heatwaves, increased cooling demands, and the intermittent nature of renewable energy generation.
- Consequently, while the market averaged around the same level as the previous month, it experienced heightened swings throughout the month, reflecting the ongoing fluctuations in supply and demand dynamics.
Market trends and futures
Source: Haya Energy Solutions
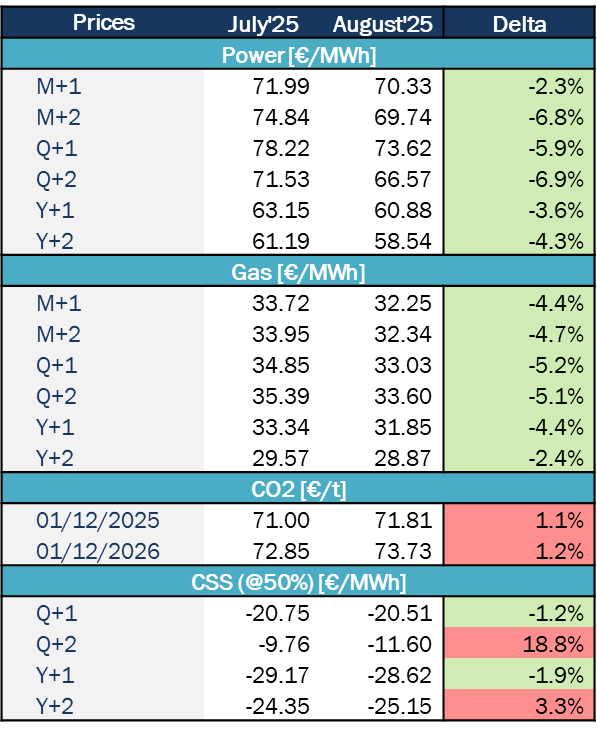
Between July and August 2025, energy markets began to anticipate lower prices for both power and gas, while carbon allowance prices trended slightly upward. Power prices decreased across all maturities, with the most significant drops occurring in short-term contracts like M+2 and Q+2, which fell by around 7%. This decline suggests a weakened demand outlook or more comfortable supply conditions as we approach the autumn and winter months.
Similarly, gas prices fell by approximately 4–5% across the curve, reflecting confidence in storage levels and supply adequacy, as well as a subdued demand forecast. In contrast, carbon dioxide (CO₂) prices experienced a modest increase, rising about 1% for both 2025 and 2026 maturities. This rise indicates ongoing regulatory pressure and tighter expectations regarding allowances.
Despite the decline in gas prices, clean spark spreads remained firmly negative, highlighting the continuing lack of profitability for gas-fired generation. While some near-term margins showed slight improvement, spreads along the longer-term curve deteriorated. This deterioration occurred because the decline in power prices outpaced the reduction in fuel costs.
Overall, the August update depicts a landscape of easing fundamentals for power and gas, paired with firmer carbon pricing. This scenario leaves gas-fired plants structurally challenged and underscores the ongoing importance of renewables and low-carbon technologies in the energy generation mix.
SP Baseload Power price (€/MWh)
SP Peak load Power price (€/MWh)
EUA price (€/t)
MIBGas price (€/MWh)
Coal Price ($/Tn)
Gas efficiency: 52%
Coal efficiency: 38%
Gas vs. Coal Price (€/MWh)
Gas efficiency: 52%
Coal efficiency: 38%