Spanish Market Analysis
Analysis of the Spanish energy market is key to understanding the dynamics and trends affecting the sector both locally and internationally. In this detailed analysis, we address the important factors influencing energy prices, supply and demand, and the latest regulatory policies. This comprehensive overview will allow you to keep up to date with weekly changes and anticipate possible market variations, both in Spain and in other relevant markets such as France.
February 2026
Table of Contents
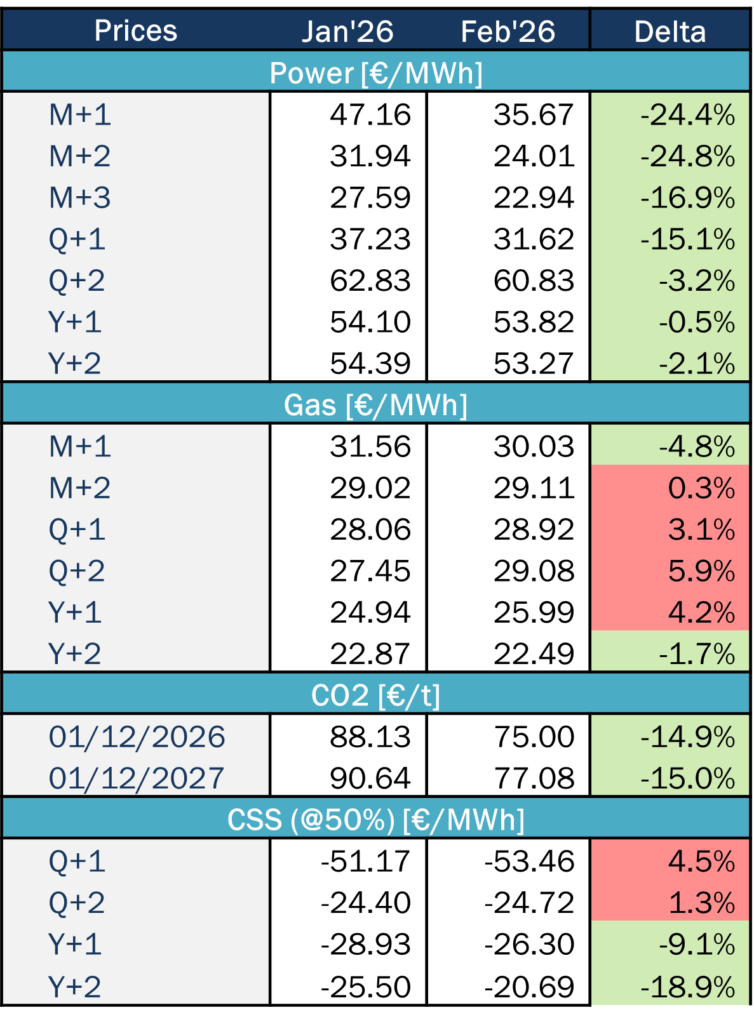
Key figures of the month
Source: Haya Energy Solutions
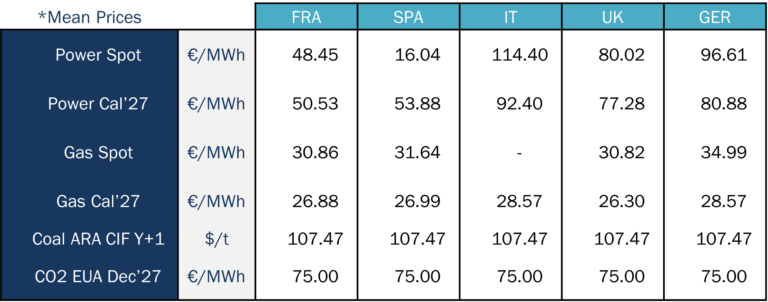
In February 2026, electricity spot prices across European markets fell considerably compared with the previous month, with Italy as the main exception. This trend is mirrored in Power Cal’27, where all countries also moved lower, though price levels remained broadly in the same range as the previous month. Most markets recorded their lowest daily prices since the beginning of the year.
Spain remained the lowest-priced market in the region, averaging 16.04€/MWh, a sharp drop from 71.67 €/MWh in the previous month. Spain also stood out for having an unusually low intramonth price range. The second-lowest market, France, averaged 48.42 €/MWh, roughly three times Spain’s level. The UK ranked third at 80.02 €/MWh, almost double France’s average. Overall, February highlighted a strong disparity in spot prices across major European markets, largely shaped by country-specific weather conditions and their impact on generation availability and the resulting power mix.
On the gas side, prices stabilised around 30 €/MWh in most markets, with Germany as an exception, posting an average monthly price closer to 35 €/MWh. In general, gas prices decreased across countries compared with the previous month. However, Gas Cal’27 showed a slight month-on-month increase across all markets. It is also noteworthy that during February, gas recorded its lowest closing prices so far this year.
Regarding CO₂, the decline was even more pronounced, moving from around 88€ in January to 75€ in February, reaching the lowest closing levels since May 2025.
Energy demand and generation mix
Source: Haya Energy Solutions
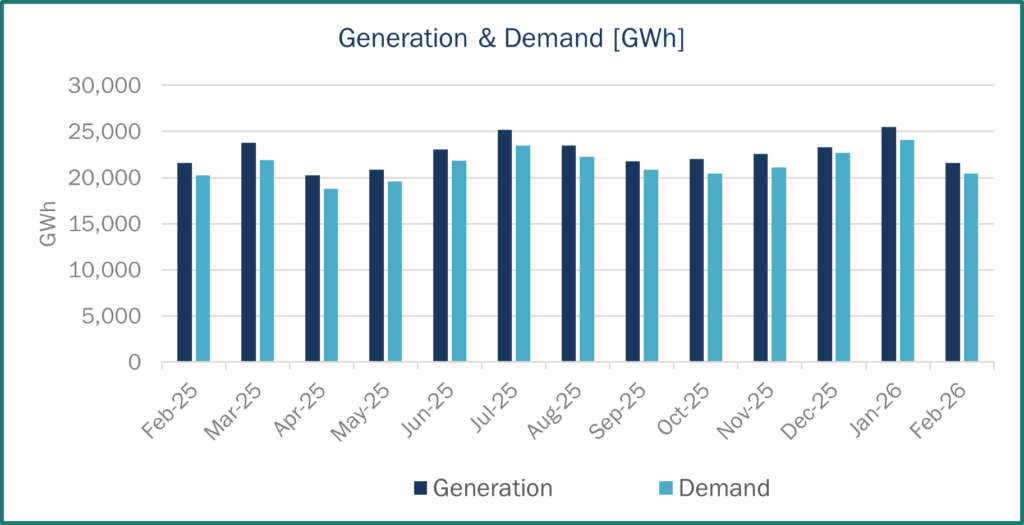
In February 2026, electricity demand in Spain reached 20,425 GWh, while total generation amounted to 21,615 GWh. Around 1,460 GWh of this output was scheduled for export.
Compared with January 2026, both electricity demand and generation were lower. Year on year, demand in February 2026 was broadly flat versus February 2025.
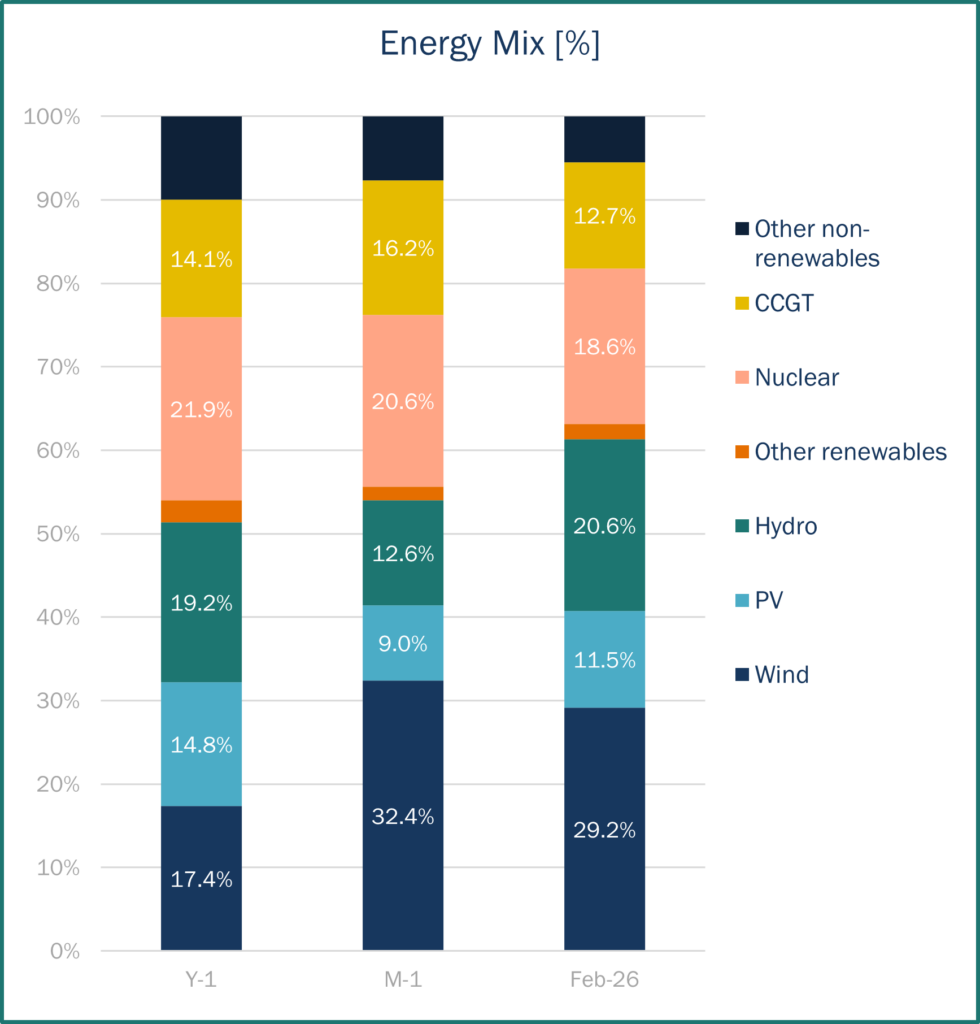
In February 2026, renewables accounted for 63.2% of Spain’s generation mix, up from 54.0% in February 2025 and 55.7% in January 2026.
The main source of generation was wind, contributing 29.2% of total output, slightly below January’s 32.4%, but well above the 17.4% recorded in the same month last year. Hydropower ranked second, rising to 20.6% of generation, nearly doubling from 12.6% in January.
These first two months of the year were described as exceptionally rainy relative to historical patterns, which supported higher hydro output (and, alongside strong wind generation, increased the availability of low-marginal-cost supply). This additional renewable generation likely reduced reliance on gas-fired units during peak hours, which contributed to lower power prices.
Nuclear accounted for 18.6% of generation in February, broadly in line with both the previous month and the same month last year. Notably, major utilities such as Endesa and Iberdrola renewed their advocacy for extending the operating lives of Spain’s nuclear plants. It is also worth noting reports of nuclear units temporarily shutting down amid persistently low prices, which is an unusual situation for February.
Source: Haya Energy Solutions
Energy prices & market panorama
Source: Haya Energy Solutions
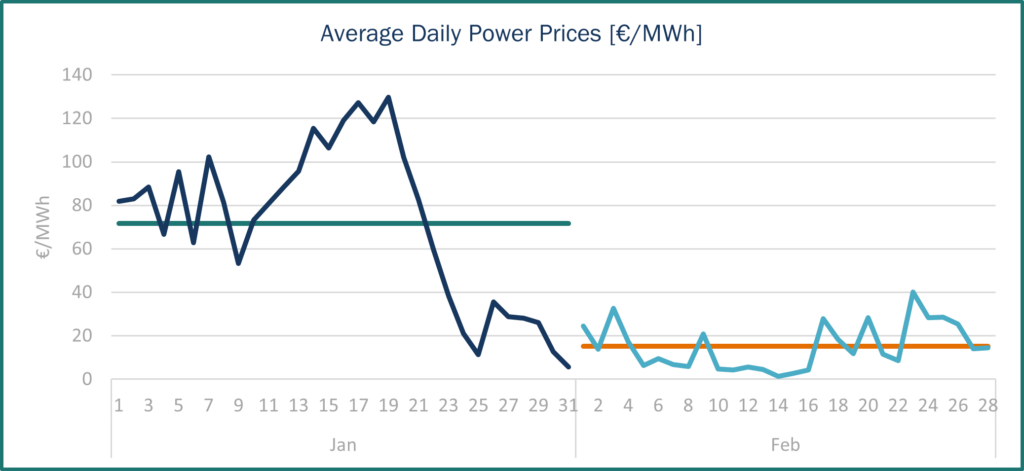
In February 2026, the average wholesale electricity price in Spain stood at 16.04 €/MWh. This represents an almost 80% decrease compared with January (71.67€/MWh), mainly supported by higher wind and hydro generation during the month.
The month was characterised by low price dispersion. There were several days with extremely low prices, sometimes close to zero. For example, the average daily price on 14 February was around 1 €/MWh. Furthermore, the highest average daily price of the month (on 26 February) barely exceeded 40 €/MWh. This is particularly notable when compared with January 2026, when there was a consecutive series of days with prices above 120 €/MWh.
Overall, this pattern once again reflects the market’s strong sensitivity to weather conditions and renewable generation availability. This can result in substantial price fluctuations and volatility from one month to the next.
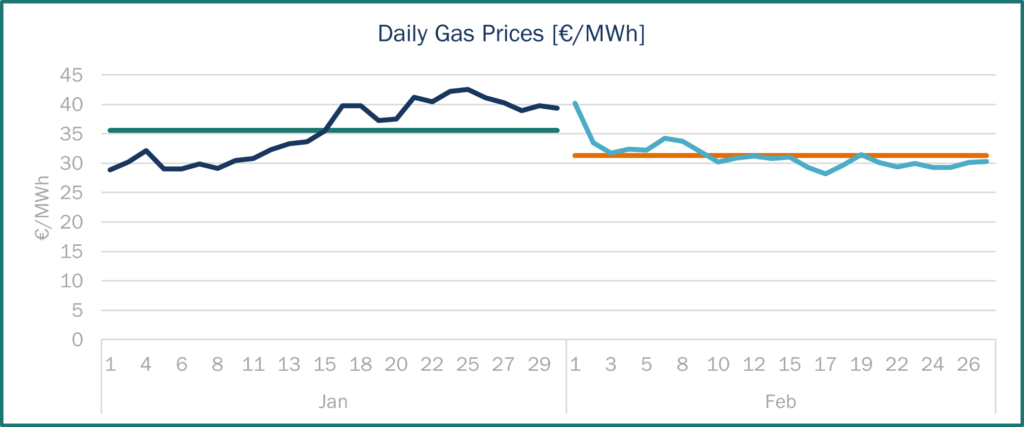
In February 2026, the average natural gas price in the Spanish market stood at 31.72 €/MWh, slightly below the 35.56 €/MWh recorded in January, representing a decline compared to the previous month.
The most notable feature of the period was the sustained downward trend observed at the beginning of the month. For the rest of February, prices remained broadly stable, fluctuating close to the monthly average with no major spikes or sudden movements. It is also worth noting that these price levels did not yet reflect the impact of the armed conflict in the Middle East, as it started on the last day of February.
Source: Haya Energy Solutions
Market trends and futures
Source: Haya Energy Solutions
During February 2026, Spanish electricity forward prices were characterised by a generalised decline. The most notable moves were the almost 25% drop in the forward prices for March 2026 and April 2026. A similar decline was also observed in the previous month for Q2 and Q3 products, where the decrease exceeded 15%. These declines were mainly supported by lower gas prices and favourable forecasts for renewable generation over the coming months. However, this trend changed with the development of the armed conflict in the Middle East, which triggered an immediate rise in gas prices and, consequently, had an impact on power forward prices. Given the relevance of this event for energy markets, it is addressed in a dedicated section of the market analysis.
In the gas market, the only significant decline was seen in the March 2026 forward price. For the rest of the curve, an upward trend was already visible, which was then amplified by the geopolitical tensions in the Middle East.
Regarding storage levels, natural gas reserves in the European Union currently stand at 30% of capacity, the lowest level in recent years. This is particularly relevant because the EU could be more exposed than other regions in the event of a price escalation, especially if it occurs while inventories are at low levels. In Spain, gas reserves currently stand at 58.03%, almost double the EU average.
Key news and implications
Since 28 February, the escalation between Israel, the US and Iran has injected an immediate geopolitical risk premium into Europe. Brent rose by around 6–7% on 2 March, while TTF jumped by over 30% (peaking near 40%). This increased CCGT marginal costs materially and, via the power market merit order, translated into higher spot and forward electricity prices as gas-fired units more frequently set the marginal price.
The key ‘tail risk’ is the closure (or near-closure) of the Strait of Hormuz. While the Strait of Hormuz carries large volumes of crude oil and LNG, most of the crude oil is bound for Asia. Europe is mainly impacted through global pricing and higher freight and insurance premiums.
For Europe, this is more direct given Europe’s reliance on flexible LNG: shipping frictions on key routes and upstream outages (including in Qatar) extend voyage times, trigger diversions and tighten the Atlantic basin, intensifying competition with Asia and lifting delivered gas costs into Europe.
However, as Europe moves into spring, lower seasonal demand and stronger wind/solar output typically reduce gas burn in the power stack, cushioning exposure (though low-renewables spells can quickly bring sensitivity back).