After a long period of decline, gas prices rose sharply in France from mid-2016 onwards:
This trend, partly explained by the rise in oil prices, also came along with increased volatility, especially in the southern trading region (TRS). What is the significance of this development, since the European gas market should have benefited fully from an increased supply of “new” LNG after many of the new liquefaction facilities around the world came on stream (Australia and the US in particular)?
There are several factors to consider:
- Recovery of demand in Asia
- Actual availability of new LNG liquefaction capacity
- Price of coal
- Role of the American gas market and its LNG exports
- Russian response
The United Kingdom’s situation is also a determining factor: first, coal consumption fell by 60% in 2016 compared to 2015, especially because of the British CO2 tax, which doubled in 2015 to £18 a ton. Gas-fired power plants generation therefore took over from coal-fired plants.
Second, the Rough gas storage plant faced major technical problems at about the same time as the Brexit vote in 2016, which led to a fall of 20% in the value of sterling: profitable exports of gas to the Continent, because of exchange rate effects during the summer of 2016, were followed by increased imports of gas to the United Kingdom during the winter of 2016/2017, especially during the cold spell in January 2017.
The capacity at Rough provides 70% of overall storage capacity for the UK, and can normally supply up to 10% of demand during a winter peak period. It went out of service in June 2016, when it was only one-third full. Its return to service has been delayed several times and it will not be available at least until the end of June 2017, once more affecting gas supplies to the UK for the 2017/2018 season.
So there is a risk of last year’s scenario being repeated: outflow of gas from the United Kingdom to the continent during the summer, leading to falling prices, then increased demand for gas into the UK during the winter, especially if there is a cold spell, that could lead to spikes in gas prices in winter 2017/2018.
These fluctuations could be exacerbated or frustrated by LNG imports to Europe, which in turn depend heavily on the demand for gas from the Asia Pacific region: there was a shortage of LNG in Europe this last winter because of severe temperatures in the Asia-Pacific zone, as well as the non-availability of several nuclear plants in South Korea.
Europe, as the outlet of last resort for LNG, and faced with a significant drop in its own domestic production, therefore finds itself as the place of arbitrage between Russian gas and imported, mainly American, LNG. So, all the conditions for increased price volatility are coming together…
The factors to be considered in understanding the particular case of the European gas market, aside from its internal problems (significant fall in domestic gas production, storage problems in the United Kingdom), may be analysed as follows:
- Recovery of demand in Asia
Asian demand for LNG rose by 7.2% in 2016. This increase was driven by rising consumption in China, India and Pakistan, especially due to the cold winter in China. But overall demand for LNG in 2016 from the 5 largest Asian buyers (Japan, Korea, Taiwan, China and India) was still below 2014 levels.
Will 2016 be a turning point for Asian demand for LNG? The recovery of key markets has been positive (China and India especially). But there is no sign of a structural shift really taking place in the use of coal in the electricity generation, industrial and heating sectors, especially in India.
- Actual availability of new LNG liquefaction capacity
Many new liquefaction facilities came on stream during 2016 (increasing the global LNG supply by 6%). But facility breakdowns, delays and commissioning problems, as well as the 6 to 9 months it takes for new plants to reach normal output levels had a serious impact on the effect of this new capacity on the market.
Existing producers (Angola, Egypt, Yemen) have also had serious technical difficulties.
In 2017, new facilities should come into service, mainly in Australia and the USA, but also in Russia (Yamal) leading to a further increase of 4% in global liquefaction capacity. Overall, an increase of 46% in the global LNG capacity is expected between 2017 and 2021!
- Price of coal
Demand for gas in Europe increased by 5.4% in 2016, ¾ of which may be attributed to increased demand from the electricity sector. Gas to replace coal has therefore been the main driver in the increased demand. Over 40% of the extra demand for gas came from the United Kingdom following the new carbon price floor there.
Coal prices also doubled between the first and fourth quarters of 2016, to the benefit of gas, and also supporting gas prices in European hubs.
Replacement of coal by gas in Europe is therefore the main mechanism for absorbing surplus LNG around the world at the moment. The comparative developments in prices of coal and gas should thus be followed closely in 2017 and beyond.
- Role of the American gas market and its LNG exports
Exports began from the United States in 2016, but are presently limited just to the Sabine Pass terminal located at the border between Texas and Louisiana. This terminal has experienced several delays and technical problems, and Europe has only received a small part of these new exports (12% by the end of January 2017), with Latin America being the main destination (47%).
It is important to bear in mind, however, that the price (and hedging) for LNG exports from the US are based on the price in European gas hubs (mainly the NBP in the United Kingdom). A total of 65 million tons a year of new LNG capacity from the US is expected to come on stream by 2021, most of which will be in 2018/19. This represents more than half of new global capacity coming into production in the next 5 years!
As the volume of American exports increases, large quantities are likely to reach Europe, or to displace cargoes which were destined for Europe to go to other destinations, such as Asia.
It will be important to closely monitor the influence of the price of the Henry Hub on global gas prices, and how it will evolve with respect to European prices such as the NBP.
- Russian response
Europe will become the place of confrontation between LNG, increasingly imported from the USA, and gas imported by pipeline from Russia.
2016 saw lower than expected European imports of LNG, because of high demand from Asia and the Middle East and delays and/or interruptions to LNG projects. Russia and North Africa therefore filled the gap. But the rise in Russian imports was mainly driven by increased withdrawals of European buyers on their contracts, within the limits of their flexibility, and not by Gazprom’s decision to increase output. In particular, high volumes seen in the 4th quarter of 2016 can be explained by the lag in the impact of the rise in oil prices on Russian gas prices, which fell below prices on European hubs.
The oil price level, which is a determining factor for the price of Russian gas, should therefore be monitored closely to assess Russia’s capacity to protect its market share in Europe against American LNG.
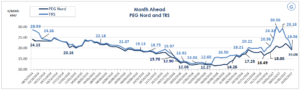
Focus on the French gas market, especially the southern zone (TRS)
France has experienced a tense situation for gas and electricity during the 2016/2017 winter. While gas market prices remained aligned against the other northern markets, this tense situation led to a rise in the price of gas day on day in the southern region (TRS), which reached up to 40€/MWh on 26 January.
This situation arose mainly due to local congestions in south-eastern France, which is part of the TRS market zone, because of a shortage of gas in storage, and especially because of the lack of LNG arriving at the Fos terminal throughout January (in addition to large gas exports to Spain). While the French authorities did not trigger the crisis management tool at a national level (neither a warning nor an emergency) GRTgaz reported several yellow and red alerts between mid-December and the end of January because of many network management problems at the regional level.
The planned merger of the North and TRS zones for the end of 2018 will not entirely eliminate the congestion problems in the southern zone. In some scenarios, the North-South link may even be still inadequate to ensure continuity of gas supplies to the southern zone. There is therefore a fear that the volatility of prices in the southern zone could spill over to the north, causing the Northern PEG prices (then a single PEG France) to rise during particularly difficult periods, such as cold spells. The North Zone would then be trapped between the volatility of two “island” zones, in terms of gas: the southern zone and the United Kingdom.
This situation could be made worse if, as the International Energy Agency (IEA) fears, oil prices rise sharply after 2020. The growth in oil supplies could actually be stopped at that time, if the record fall in investment during 2015 (-25 %) and 2016 (-26 %) in the oil sector were not speedily reversed. A further oil crisis could even threaten after 2020 if investments do not take off again very quickly.
So the oil production capacity margin would fall to its lowest level for 14 years in 2020, under 2 million barrels a day.
Conclusion
European gas prices are more than ever dependent on the comparative attraction for American LNG to send its output to Asia rather than to Europe, despite the differential in transport costs. And in Asia the price of LNG is directly linked to the oil price.
A rise in oil prices by 2022 could therefore quickly affect the cost of gas in Europe, through LNG arbitrage.
Philippe Lamboley