Key Insights from the French Market Analysis
Analysis of the French energy market is key to understanding the dynamics and trends affecting the sector both locally and internationally. In this detailed analysis, we address the important factors influencing energy prices, supply and demand, and the latest regulatory policies. This comprehensive overview will allow you to keep up to date with weekly changes and anticipate possible market variations, both in France and in other relevant markets such as Spain.
Table of Contents
February 2026
Key figures of the month
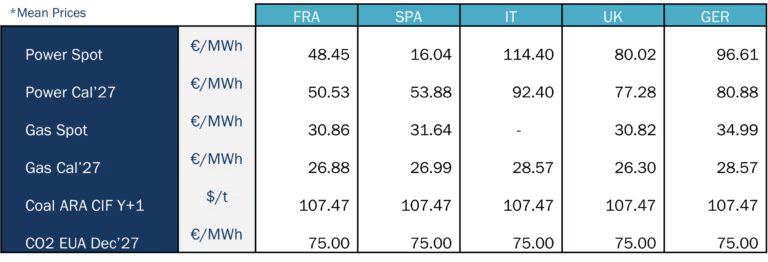
Source: Haya Energy Solutions
In February 2026, electricity spot prices across European markets fell considerably compared with the previous month, with Italy as the main exception. This trend is mirrored in Power Cal’27, where all countries also moved lower, though price levels remained broadly in the same range as the previous month. Most markets recorded their lowest daily prices since the beginning of the year.
Spain remained the lowest-priced market in the region, averaging 16.04€/MWh, a sharp drop from 71.67 €/MWh in the previous month. Spain also stood out for having an unusually low intramonth price range. The second-lowest market, France, averaged 48.5 €/MWh, roughly three times Spain’s level. The UK ranked third at 80.02 €/MWh, almost double France’s average. Overall, February highlighted a strong disparity in spot prices across major European markets, largely shaped by country-specific weather conditions and their impact on generation availability and the resulting power mix.
On the gas side, prices stabilised around 30 €/MWh in most markets, with Germany as an exception, posting an average monthly price closer to 35 €/MWh. In general, gas prices decreased across countries compared with the previous month. However, Gas Cal’27 showed a slight month-on-month increase across all markets. It is also noteworthy that during February, gas recorded its lowest closing prices so far this year.
Regarding CO₂, the decline was even more pronounced, moving from around 88€ in January to 75€ in February, reaching the lowest closing levels since May 2025.
Energy demand and generation mix
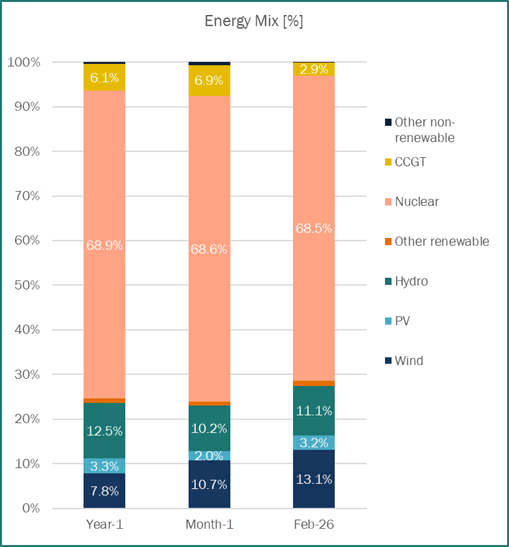
Source: Haya Energy Solutions
In February2026, average total generation in France reached 45,803 GWh.
Nuclear power remains the backbone of the French generation mix, playing a key role in ensuring system security of supply (68.47% of February’s energy mix). Compared to February 2025 (and January 2026; Flamanville nuclear power plant was taken offline due to technical issues removing 2.6 GW of baseload capacity), CCGTs participation has been drastically reduced (2.9%) due to strong nuclear and wind generation.
In the matter of renewable energy sources, as you can see from the graph, wind production comes second in the total energy mix, representing a 13.1% out of the total production and first in the renewable energy category. Hydroelectric stocks increased from 1,321 GWh (at the end of January) to 1,430 GWh (at the end of February), above last year’s level (1,226 GWh). Finally, photovoltaic production is minimum during these months as we are in the least sunny period of the year (November to February).
Energy prices & market panorama
February’s average spot electricity price in France reached 48.5 €/MWh, a 60% decrease compared to February-25’s levels (122.7 €/MWh). As the graph shows, prices fluctuated considerably throughout the month with the minimum average daily spot price reaching 9.7 €/MWh on the 22nd of February, and the maximum average daily spot price reaching 110.21€/MWh on 1st February. Power prices decreased considerably in February, mainly driven by above-normal temperatures, strong wind output and high nuclear generation. French day-ahead prices frequently dropped to very low or even near-zero levels at midday. Regarding imports and exports, in February, France was in a position of net exporter with all its borders, except Spain. The maximum level of exports during a day for the month was 18,323 MW.

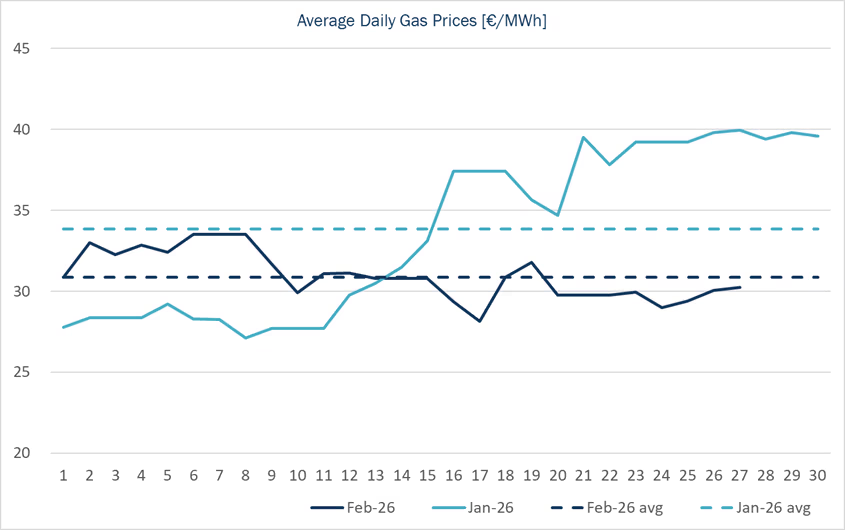
Source: Haya Energy Solutions
Regarding PEG contract, throughout February, spot prices decreased 9% compared to January 2026, the prices were between 28.2€/MWh and 33.5€/MWh. At the beginning of the month, spot prices have been supported by colder weather forecasts but later pressured by strong wind generation and above-normal temperatures limiting storage withdrawals. After January’s increase, February’s prices retake their downward trend seen in the last year since February 2025 (except punctual weeks in May and June) where lowest price reached around c.25 €/MWh. Toward the end of the month, geopolitical tensions with Iran reintroduced risk premium.
EU gas stocks are 29.98% full on average, compared to 38.18% last year. France’s gas storage levels are at 21.54%, below 2025 (22.61%).
Source: Haya Energy Solutions
Market trends and futures
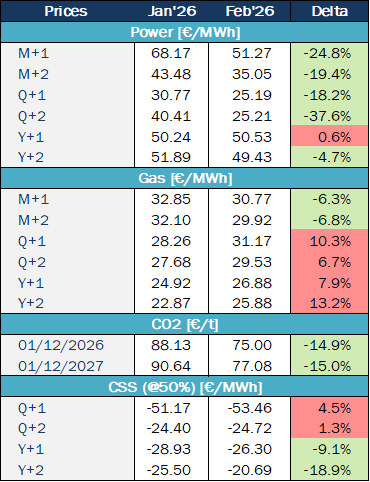
Source: Haya Energy Solutions
During February, French power futures softened progressively as gas and carbon prices declined mid-month, narrowing spreads such as the DE-FR Cal+1 spread to around €26–27/MWh. By late February, weaker demand growth expectations in France further weighed on forward power prices. Cal-28 continued a downward trend, reaching its lowest levels (47.1€/MWh) in over a year, supported by lower gas dependency, improving demand expectations, and increasing renewable capacity. However, on the middle of the month, the tendency reverse.
Geopolitical developments became the dominant driver in the second half of February, shifting markets from surplus concerns to supply disruption fears. Early diplomatic signals between the US, Russia and Iran temporarily reduced risk premiums, but escalating tensions and threats to the Strait of Hormuz quickly reversed sentiment. Futures markets across oil and gas increasingly priced in tail risks, even when physical fundamentals remained relatively comfortable.
EUA prices experienced their sharpest drawdown since February 2024, falling from around €94/t earlier in the cycle to near €70/t within roughly 20 trading sessions, mainly due to discussions about softening the phase-out of free allocations under the EU ETS. Spot and Dec-26 futures both reflected this policy-driven sell-off, with the ICE Dec-26 contract closing near €70–72/t late in the month. Although some short-term rebounds occurred on lower wind forecasts and speculative position reductions, sentiment remained fragile and largely headline-driven rather than fundamentally tight.
During February, oil prices first moved lower on oversupply expectations, with the IEA projecting a 3.7 mb/d surplus in 2026 and revising demand growth down to 850 kb/d, keeping Brent spot around $67–68/b mid-month. Futures reflected this bearish balance with a relatively flat structure. However, escalating tensions around Iran and risks to the Strait of Hormuz triggered a sharp late-month spike, pushing spot Brent above $80/b, with nearby futures strengthening on renewed geopolitical risk premium.
Regulation
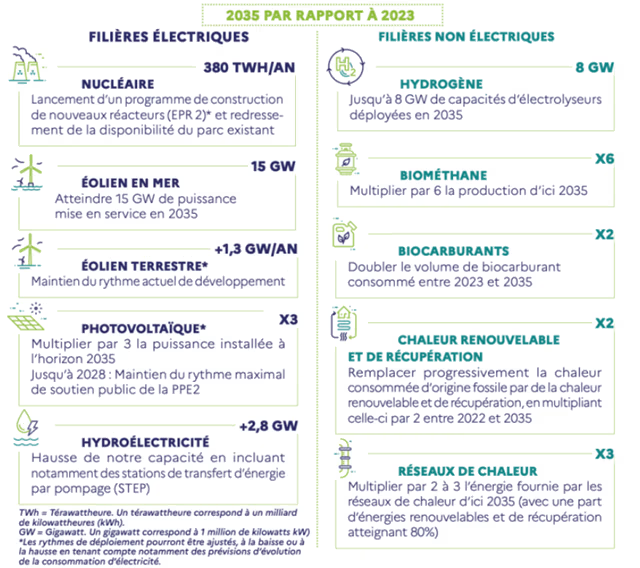
On 13 February 2026, by decree dated 12 February, the French Government published the new edition of the Multiannual Energy Plan (PPE), together with its annex dedicated to the Clean Mobility Development Strategy (SDMP). This edition sets out France’s energy policy framework for the period 2026-2035. Its publication comes more than two years late.
From a quantitative perspective, the PPE sets out key targets for 2035 compared with 2023 levels. Nuclear generation is expected to reach 380 TWh per year through the construction of new EPR2 reactors and improved availability of the existing fleet. Offshore wind capacity is set to reach 15 GW, while onshore wind will continue to grow at around 1.3 GW per year. Solar PV capacity is expected to triple by 2035, and hydropower capacity will increase by about 2.8 GW, notably through the development of pumped storage facilities. The plan aims to deploy up to 8 GW of electrolysis capacity for hydrogen, increase biomethane production sixfold, double biofuel consumption, and double renewable and recovered heat production. Finally, the energy supplied by district heating networks is expected to triple, with the share of renewable and recovered energy reaching 80%.
Key news and implications
Since 28 February, the escalation between Israel, the US and Iran has injected an immediate geopolitical risk premium into Europe. Brent rose by around 6–7% on 2 March, while TTF jumped by over 30% (peaking near 40%). This increased CCGT marginal costs materially and, via the power market merit order, translated into higher spot and forward electricity prices as gas-fired units more frequently set the marginal price.
The key ‘tail risk’ is the closure (or near-closure) of the Strait of Hormuz. While the Strait of Hormuz carries large volumes of crude oil and LNG, most of the crude oil is bound for Asia. Europe is mainly impacted through global pricing and higher freight and insurance premiums.
For Europe, this is more direct given Europe’s reliance on flexible LNG: shipping frictions on key routes and upstream outages (including in Qatar) extend voyage times, trigger diversions and tighten the Atlantic basin, intensifying competition with Asia and lifting delivered gas costs into Europe.
However, as Europe moves into spring, lower seasonal demand and stronger wind/solar output typically reduce gas burn in the power stack, cushioning exposure (though low-renewables spells can quickly bring sensitivity back).