Europe has expanded its capacity to import LNG—but can it secure the cargoes it needs? Disrupted Gulf supplies and competition from Asian buyers have complicated the supply outlook for 2026, while a smaller storage buffer leaves less room for further shocks this winter. Across Europe’s six largest LNG importers, the picture is uneven: imports have fallen in France, the Netherlands, Spain and Belgium, remained broadly stable in Italy and risen in Germany. The supplier mix is also shifting, with greater reliance on U.S. LNG in several markets and continued exposure to Russian LNG in others. This article examines the changes in import volumes, their origins and what competition for available cargoes could mean for European gas prices and energy security.
Europe entered 2026 expecting new LNG export capacity, particularly in North America, to ease supply constraints. Instead, disrupted shipping through the Strait of Hormuz and damage to Middle Eastern gas infrastructure have delayed that relief. Assuming flows through Hormuz remain largely disrupted until year-end, the IEA now forecasts a 3% decline in global LNG supply this year. Additional production elsewhere is cushioning the losses but has not fully replaced missing Qatari and Emirati volumes. ACER reports that no significant Qatari LNG volumes reached the EU during summer 2026, when total EU LNG imports fell by 14% year on year.
For Europe, this has changed both the supplier mix and the nature of supply risk. Reduced Qatari deliveries have increased reliance on U.S. LNG, while Asian buyers are competing for the same flexible cargoes. Diversification away from Russian gas has strengthened access to alternative suppliers, but greater dependence on globally traded LNG exposes European buyers to shipping disruptions, infrastructure outages and international price competition.
These pressures arrive as Europe enters winter with a smaller storage buffer. Its expanded LNG terminals provide valuable import capacity, but available terminal space does not guarantee available cargoes. The central challenge is therefore securing sufficient gas, at an affordable price, when demand rises. A cold winter, further supply interruptions or stronger Asian purchasing could tighten that balance—and increase the cost of rebuilding European inventories in 2027.
How have LNG imports changed across Europe’s six largest importing countries? Where do their supplies come from, and how does global demand affect competition for cargoes?
The following analysis examines import trends, year-on-year changes and supplier origins before turning to the wider demand outlook.
LNG Import Fluctuations Across Europe’s Top Six Importing Countries
France, the Netherlands, Spain and Italy were the leading LNG importers in 2025, followed closely by Belgium and Germany. Imports across all six countries were broadly stable after May. EU storage requirements may have contributed to this pattern
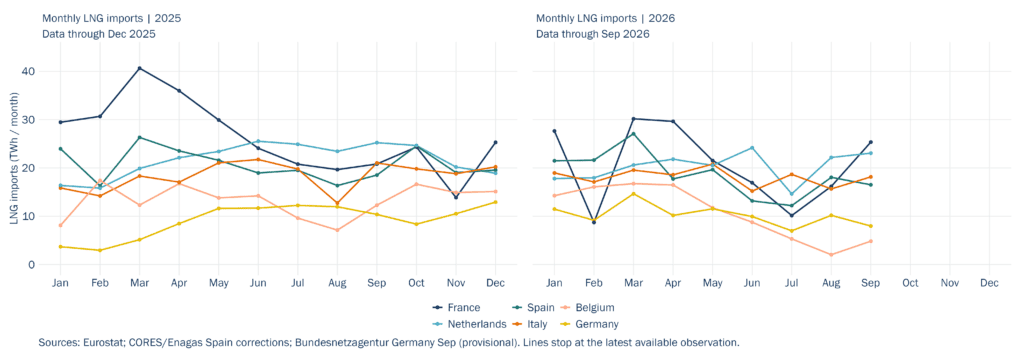
France’s Q1 2025 residential, commercial and small-industry gas consumption rose by 6.1% year on year as colder weather, low inventories and exports to neighbouring markets supported LNG requirements. Greater U.S. cargo availability helped meet inflows, contributing to the March peak despite improved nuclear availability. In 2026, imports fell from approximately 30 TWh in March–April to 10 TWh in July, recovering to around 25 TWh in September. Milder weather and stronger nuclear and solar generation contained demand; Q2 nuclear output rose by 8.7% year on year while primary gas consumption fell by 0.5%. Gulf disruption and cargo competition added supply pressure, rather than a widespread French nuclear shortage.
The Netherlands’ LNG inflows in 2025 were supported by storage replenishment, power generation and exports to Germany, despite broadly unchanged domestic gas consumption. Gas transported to storage rose by 21%, while power-station consumption increased by more than 17%. These pressures persisted in the first half of 2026: total gas demand rose by 2% year on year and power-sector consumption by 12%. Storage was only 5% full at end-March and 26% at end-June, versus 21% and 49% a year earlier. Replenishment needs sustained demand for incoming gas, although actual injections remained lower; Gulf disruption and cargo competition increased procurement exposure.
Spain’s Q1 2025 gas demand, including exports, rose by 3.4% year on year, while pipeline exports increased by 42.3%. Gas-fired generation grew by 41.2% in the first half as combined-cycle plants played a greater role following the April blackout. Power-sector gas consumption rose by a further 19% year on year during January–September 2026, including 46.8% in March as wind and nuclear output declined. Similar generation pressures returned in August. LNG imports peaked in March, weakened during summer and recovered in August; pipeline supplies also met requirements, so stronger gas demand alone does not explain monthly LNG arrivals.
Italy’s gas demand rose by 6% year on year in the first half of 2025, with power-sector consumption up 11.9% as hydroelectric output and electricity imports fell. Lower pipeline imports helped lift LNG imports by approximately 32%, while Ravenna’s May start-up expanded capacity. In the first half of 2026, lower rainfall and higher electricity demand supported a 4.1% rise in thermoelectric gas consumption, partly offset by milder-weather reductions in residential and commercial demand. LNG imports held around 15–20 TWh monthly, supported by diversified infrastructure and supplies despite Middle Eastern disruption. Snam’s consolidated terminals handled 62 cargo unloadings, versus 45 a year earlier.
Belgium’s transit role supported strong LNG activity in the first half of 2025: border-to-border flows rose by 20% to 160 TWh, with higher deliveries to Germany and the Netherlands, while nearly 80 vessels unloaded at Zeebrugge. In 2026, strong early arrivals supporting German exports gave way to fewer shipments from May and exceptionally low July–August activity. First-half domestic gas consumption remained broadly stable, but power-sector use rose by 11.3% year on year amid prolonged nuclear maintenance; low renewable output and the late-June heatwave added demand pressures. Falling arrivals therefore reflect regional transit needs, cargo availability and trading conditions not domestic demand alone.
Germany’s terminals imported 106 TWh in 2025 as gas consumption recovered by 2.2%. Wilhelmshaven 2 began commissioning in late May and commercial operation at end-August, expanding direct LNG access alongside neighbouring pipeline supplies. In 2026, imports peaked in March, declined through July and partly recovered in August, reaching 7.97 TWh in September based on daily terminal inflows. Predominantly U.S. sourced supplies limited direct Qatari exposure but faced stronger Asian competition for Atlantic cargoes market context.
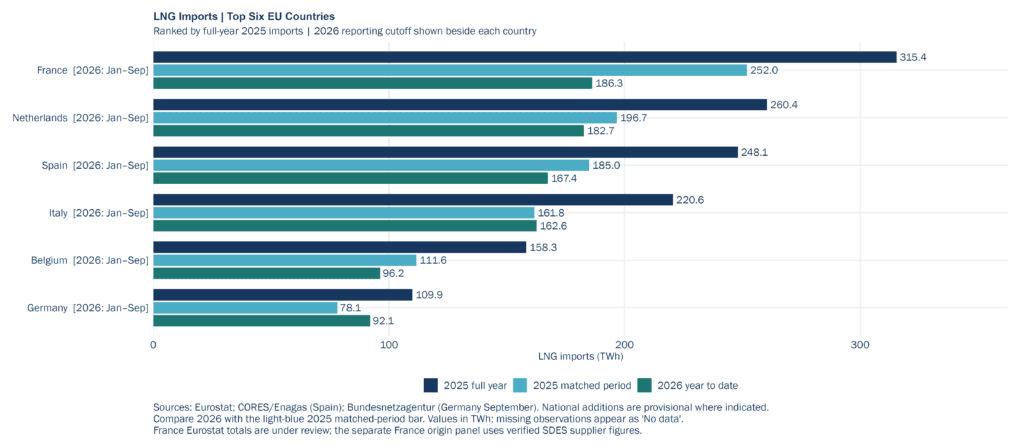
These monthly fluctuations translate into a marked divergence across the EU’s six largest LNG importers. Comparing January–September 2026 with the same period in 2025, France recorded the largest reduction, with imports falling approximately 26% to 186.3 TWh. Nevertheless, it remained the largest importer among the six, narrowly ahead of the Netherlands, where volumes declined around 7% to 182.7 TWh. Spain’s imports decreased approximately 10% to 167.4 TWh, while Belgium recorded a sharper contraction of almost 14%, reaching 96.2 TWh. Italy remained broadly stable at 162.6 TWh, up 0.5%. Germany moved in the opposite direction, increasing imports approximately 18% to 92.1 TWh. Together, the six countries imported approximately 887 TWh during the first nine months of 2026, around 9% below the corresponding 2025 period. Germany’s growth and Italy’s resilience therefore only partly offset the reductions elsewhere. These figures measure LNG imports; assessing their implications for gas demand requires considering pipeline supplies, storage movements and cross-border flows alongside them.
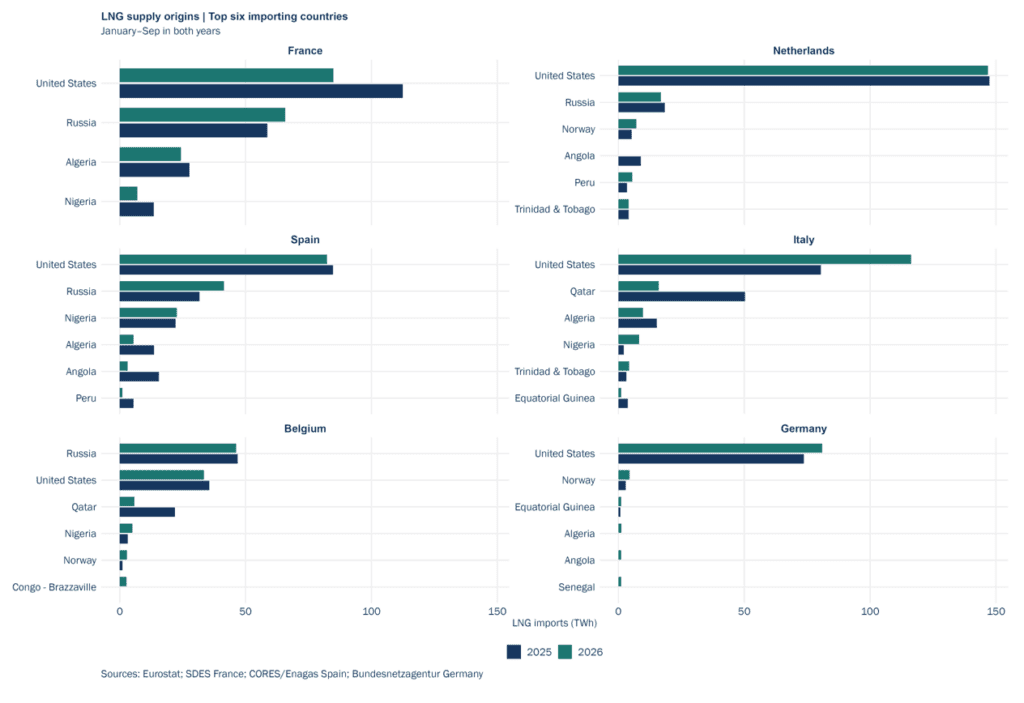
Beyond changes in total import volumes, the supplier breakdown highlights Europe’s uneven exposure to individual LNG exporters. The United States dominates supplies to the Netherlands and Spain and accounts for most of Germany’s estimated imports. In Italy, higher US volumes alongside lower Qatari deliveries indicate a shift towards Atlantic supply during January–September 2026. Belgium presents a different profile, with Russia remaining its largest identified supplier, followed by the United States. Spain also continues to receive substantial Russian volumes, illustrating that diversification away from Russian pipeline gas does not necessarily eliminate exposure to Russian LNG. These patterns underline the distinction between expanding the number of suppliers and reducing concentration. Access to US cargoes provides supply flexibility, but dependence on a dominant exporter leaves importers exposed to disruptions affecting its production, export terminals and shipping routes.
At the same time, the EU is proceeding with the phase-out of Russian gas imports, completing a fundamental shift away from its longstanding reliance on Russian supplies. Following restrictions already introduced in 2026, the remaining eligible long-term Russian LNG imports will be prohibited from 1st January 2027. The corresponding ban on remaining eligible pipeline imports will apply from 30th September 2027, with a possible Commission-authorised delay until 1 November 2027 in Member States facing a risk of missing their gas-storage filling targets.
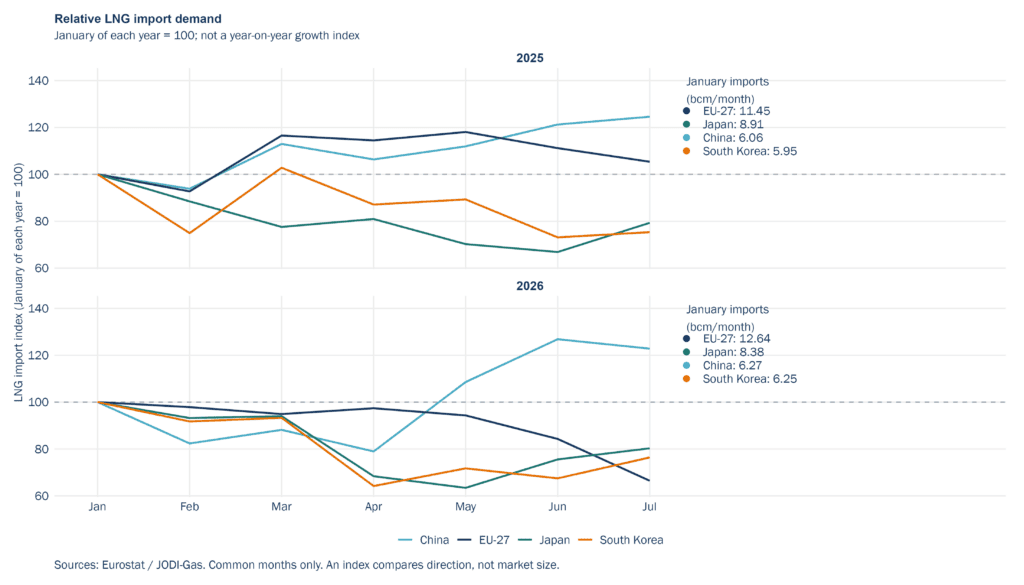
The chart compares LNG imports with each market’s January baseline within each year; it does not show year-on-year growth or rank markets by import volume. In 2026, China shows the strongest recovery from that baseline: July imports were approximately 23% above January, while EU imports were around 34% below. Japan and South Korea also remained below their January levels, although both recovered towards July. This comparison places Europe’s supplier exposure in the wider context of competition from Asian buyers.
Between March and June 2026, the Asian LNG benchmark JKM averaged USD 2.1 per million British thermal units (MMBtu) above the European gas benchmark TTF, encouraging cargo diversions towards Asia, according to the IEA. This illustrates Europe’s pricing exposure when stronger Asian purchasing coincides with limited cargo availability: higher Asian prices can attract flexible shipments, forcing European buyers to raise their bids to secure supply. A simultaneous rise in winter demand across both regions could intensify that competition and put upward pressure on European gas prices.
Europe’s LNG challenge is therefore not simply a question of terminal capacity. The first nine months of 2026 show diverging import trends, shifting supplier dependence and continued competition for flexible cargoes. For the coming winter, the key question is whether available supplies and storage can meet demand at an affordable price, especially if cold weather or further disruptions tighten the market.
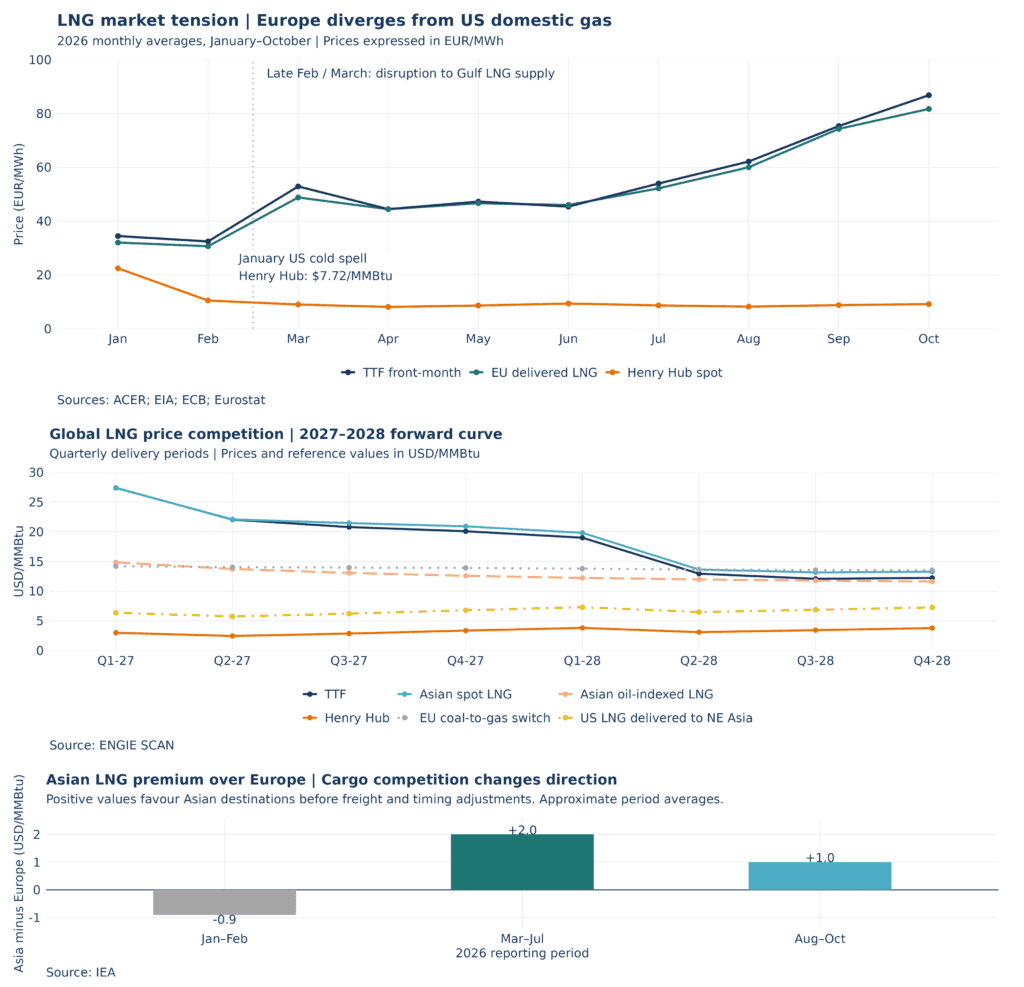
The first graph highlights the difference between the TTF 2026-month ahead prices, the cost of gas in the United States (Henry Hub) and the price of securing LNG internationally.
Henry Hub eased after January’s cold-weather spike, while European LNG and TTF prices increased substantially. This divergence illustrates why relatively inexpensive US gas does not automatically translate into inexpensive LNG for European buyers: export capacity, liquefaction, shipping and competition between destinations also influence delivered prices.
This points a narrowing gap between destination prices and the US supply-cost reference. However, forward prices are current market indications rather than guaranteed outcomes, and these differences should not be interpreted as exporter profit margins. The competition with Asia remains particularly important for Europe. The Asian premium increased from approximately minus 0.9$/MMBtu in January–February to plus 2$/MMBtu in March–July, before narrowing to around plus 1$/MMBtu in August–October. Positive premiums can attract flexible cargoes towards Asia, requiring European buyers to offer more competitive prices. Nevertheless, a smaller premium does not necessarily indicate cheaper gas: it can also reflect Europe raising its bids.
Europe’s LNG transition faces supply constraints
Europe’s efforts to diversify its gas supply continue to face a challenging reality: Russian LNG remains an important source of deliveries, while new Qatari capacity faces uncertainty over construction schedules and export routes.
EU imports from Russia’s Yamal LNG project reached 12.18 million tonnes in January–September 2026. Across the period, 167 cargoes arrived at EU ports, France received nearly three-quarters of EU-bound Yamal LNG volumes in September, reinforcing its role as an entry point for Russian supplies. However, third-quarter imports fell 13.6% year on year, showing that the nine-month increase masks a more recent slowdown. For European buyers, the transition will require sufficient alternative cargoes, reliable transport routes and adequate import infrastructure.
Qatar’s expansion offers substantial additional supply, but its timing remains uncertain. QatarEnergy’s September guidance placed first production from North Field East in the first half of 2027, compared with the earlier 2026 target. Subsequent trains remain exposed to equipment-delivery constraints linked to disruption through the Strait of Hormuz. The country is also managing damage to existing facilities at Ras Laffan. Attacks affected approximately 17% of Qatar’s LNG capacity, with repairs to two damaged trains potentially taking up to three years. The recovery of existing production and the commissioning of new capacity therefore represent separate—and potentially overlapping—supply challenges.
Against this backdrop, QatarEnergy is expanding its international supply portfolio. On 22nd October 2026, it announced agreements to purchase up to 4 million tonnes annually from Cheniere, with deliveries expected from 2031 through 2054. These agreements strengthen longer-term diversification, but their delivery schedule places them beyond the immediate supply-recovery period. For energy buyers, the central issue is the timing of dependable, deliverable supply. Procurement strategies will need to account for the overlap between Europe’s Russian gas phase-out, uncertain Qatari production schedules and continuing shipping risks.
With regards to the next years expectation, up to date the global LNG price forward curve shows higher prices for the beginning of 2027 and lower TTF and Asian LNG prices across the later 2027–2028 delivery periods, while Henry Hub and the US delivered-LNG reference remain firmer. Markets seem to anticipate a return of some Qatari LNG from Q2 2028, that is a year and a half from now, spanning 2 winter seasons, therefore the key question remains: can the market navigate the two intervening winters without significant price spikes, particularly if the anticipated return of Qatari LNG is delayed?
Cheyenne Rueda Lagasse